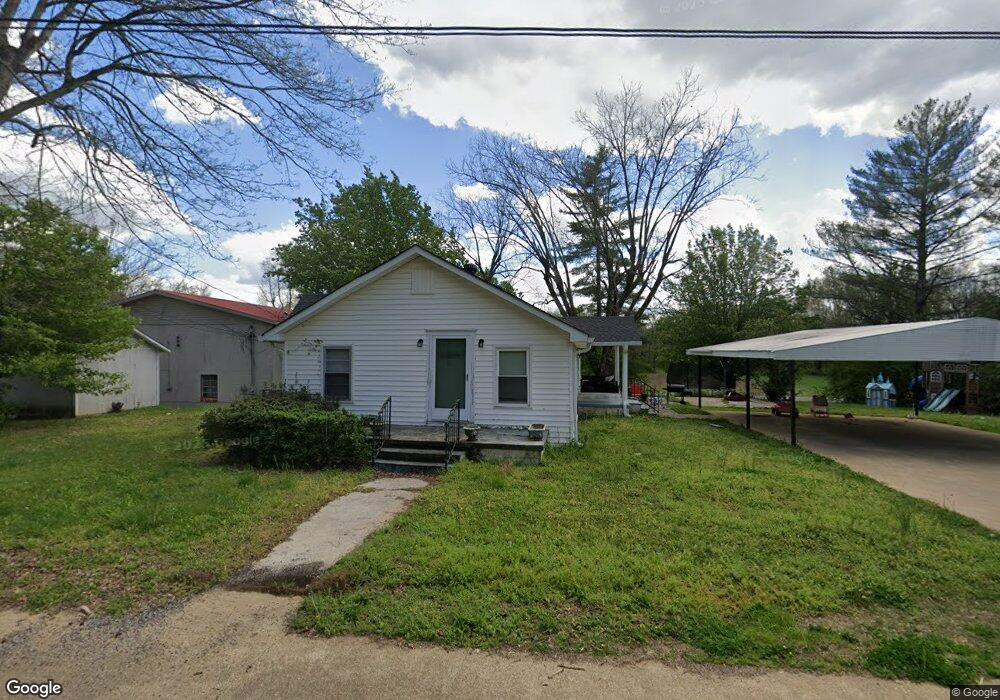
202 Henley St Summerville, GA 30747
Estimated Value: $154,906 - $222,000
--
Bed
--
Bath
1,301
Sq Ft
$147/Sq Ft
Est. Value
About This Home
This home is located at 202 Henley St, Summerville, GA 30747 and is currently estimated at $190,727, approximately $146 per square foot. 202 Henley St is a home with nearby schools including Chattooga High School.
Ownership History
Date
Name
Owned For
Owner Type
Purchase Details
Closed on
Oct 7, 2022
Sold by
Lenderman Lauren Kelley
Bought by
Flood Nicholas W
Current Estimated Value
Home Financials for this Owner
Home Financials are based on the most recent Mortgage that was taken out on this home.
Original Mortgage
$149,246
Outstanding Balance
$142,641
Interest Rate
5.12%
Mortgage Type
FHA
Estimated Equity
$48,086
Purchase Details
Closed on
Oct 4, 2022
Sold by
Lenderman Carter
Bought by
Lenderman Lauren Kelly
Home Financials for this Owner
Home Financials are based on the most recent Mortgage that was taken out on this home.
Original Mortgage
$149,246
Outstanding Balance
$142,641
Interest Rate
5.12%
Mortgage Type
FHA
Estimated Equity
$48,086
Purchase Details
Closed on
May 16, 2022
Sold by
Lenderman Carter Lee
Bought by
Lenderman Lauren Kelly
Purchase Details
Closed on
Sep 26, 2013
Sold by
Lenderman Dorothy P
Bought by
Lenderman Marcus Lee and Lenderman Lauran Kelly
Purchase Details
Closed on
Feb 1, 2008
Sold by
Lenderman Dorthy Pursley
Bought by
Pursley Lenderman Marcus Leon and Pursley Lenderman Rorothy
Create a Home Valuation Report for This Property
The Home Valuation Report is an in-depth analysis detailing your home's value as well as a comparison with similar homes in the area
Home Values in the Area
Average Home Value in this Area
Purchase History
| Date | Buyer | Sale Price | Title Company |
|---|---|---|---|
| Flood Nicholas W | $152,000 | -- | |
| Lenderman Lauren Kelly | -- | -- | |
| Lenderman Lauren Kelly | $20,000 | -- | |
| Lenderman Marcus Lee | -- | -- | |
| Pursley Lenderman Marcus Leon | -- | -- |
Source: Public Records
Mortgage History
| Date | Status | Borrower | Loan Amount |
|---|---|---|---|
| Open | Flood Nicholas W | $149,246 |
Source: Public Records
Tax History Compared to Growth
Tax History
| Year | Tax Paid | Tax Assessment Tax Assessment Total Assessment is a certain percentage of the fair market value that is determined by local assessors to be the total taxable value of land and additions on the property. | Land | Improvement |
|---|---|---|---|---|
| 2024 | $1,215 | $53,440 | $1,640 | $51,800 |
| 2023 | $1,497 | $53,320 | $3,680 | $49,640 |
| 2022 | $714 | $23,217 | $1,718 | $21,499 |
| 2021 | $549 | $18,319 | $1,718 | $16,601 |
| 2020 | $490 | $16,338 | $1,718 | $14,620 |
| 2019 | $490 | $16,338 | $1,718 | $14,620 |
| 2018 | $505 | $16,841 | $1,710 | $15,131 |
| 2017 | $505 | $16,841 | $1,710 | $15,131 |
| 2016 | -- | $16,840 | $1,710 | $15,130 |
| 2015 | -- | $17,060 | $1,710 | $15,350 |
| 2014 | -- | $17,060 | $1,710 | $15,350 |
| 2013 | -- | $17,060 | $1,710 | $15,350 |
Source: Public Records
Map
Nearby Homes
- 149 Kirby St
- 102 Oak St
- 147 Hill St
- 190 E Washington St
- 185 Georgia Ave
- 103 Highland Ave
- 68 Montgomery St
- 285 Congress St
- 57 N Congress St
- 10117 Commerce St
- 0 Hinton St Unit 22750516
- 310 Georgia Ave
- 394 Roseway Cir
- 412 W First Ave
- 1330 Georgia 114
- 101 Turner St
- 8 Sturdivant Dr
- 155 Scoggins St
- 1509/11 Georgia 100
- 1509/11 Georgia 100 Unit 45-48
- 203 Henley St
- 76 Jones St
- 26 Jones St
- 126 Jones St
- 109 Henley St
- 79 Jones St
- 291 Jones St
- 106 Henley St
- 125 Jones St
- 95 Jones St
- 85 Henley St
- 0 Jones St
- 0 Jones St Unit 8398405
- 0 Jones St Unit 7159276
- 0 Jones St Unit 7051213
- 0 Jones St Unit 7021529
- 0 Jones St Unit 3043186
- 0 Jones St Unit 8173644
- 0 Jones St Unit 8957239
- 0 Jones St Unit 9019320