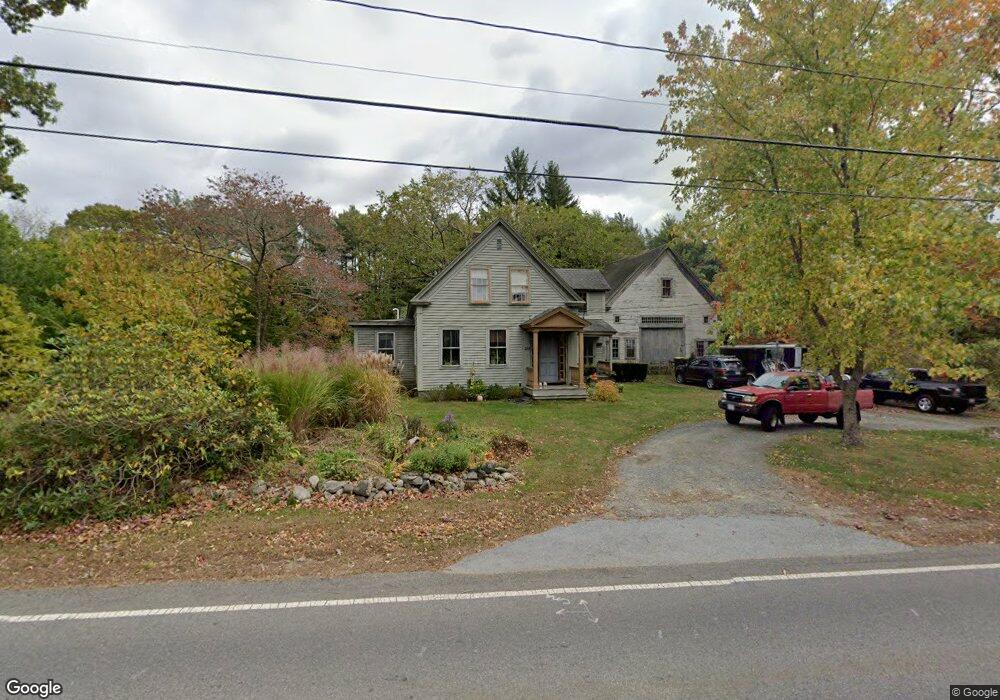
202 High St Hanson, MA 02341
Estimated Value: $554,000 - $858,000
4
Beds
2
Baths
2,589
Sq Ft
$268/Sq Ft
Est. Value
About This Home
This home is located at 202 High St, Hanson, MA 02341 and is currently estimated at $694,184, approximately $268 per square foot. 202 High St is a home located in Plymouth County.
Ownership History
Date
Name
Owned For
Owner Type
Purchase Details
Closed on
Jan 27, 1988
Sold by
Fogarty Thomas
Bought by
Naylor Gary D
Current Estimated Value
Home Financials for this Owner
Home Financials are based on the most recent Mortgage that was taken out on this home.
Original Mortgage
$144,760
Interest Rate
10.65%
Mortgage Type
Purchase Money Mortgage
Create a Home Valuation Report for This Property
The Home Valuation Report is an in-depth analysis detailing your home's value as well as a comparison with similar homes in the area
Home Values in the Area
Average Home Value in this Area
Purchase History
| Date | Buyer | Sale Price | Title Company |
|---|---|---|---|
| Naylor Gary D | $180,950 | -- |
Source: Public Records
Mortgage History
| Date | Status | Borrower | Loan Amount |
|---|---|---|---|
| Closed | Naylor Gary D | $136,000 | |
| Closed | Naylor Gary D | $144,760 | |
| Previous Owner | Naylor Gary D | $23,000 |
Source: Public Records
Tax History
| Year | Tax Paid | Tax Assessment Tax Assessment Total Assessment is a certain percentage of the fair market value that is determined by local assessors to be the total taxable value of land and additions on the property. | Land | Improvement |
|---|---|---|---|---|
| 2025 | $6,539 | $488,700 | $190,400 | $298,300 |
| 2024 | $6,433 | $480,800 | $184,900 | $295,900 |
| 2023 | $6,370 | $449,200 | $184,900 | $264,300 |
| 2022 | $6,238 | $413,400 | $168,100 | $245,300 |
| 2021 | $12,386 | $380,000 | $161,600 | $218,400 |
| 2020 | $5,438 | $356,100 | $156,100 | $200,000 |
| 2019 | $5,272 | $339,500 | $153,200 | $186,300 |
| 2018 | $5,227 | $330,200 | $147,300 | $182,900 |
| 2017 | $5,083 | $318,100 | $140,300 | $177,800 |
| 2016 | $5,192 | $313,700 | $140,300 | $173,400 |
| 2015 | $4,943 | $310,500 | $140,300 | $170,200 |
Source: Public Records
Map
Nearby Homes
- 72 Phillips St
- 80 Phillips St
- 1054 Main St
- Lot 6 Way
- Lot 2 Harvard Rd
- 361A County Rd
- 361 County Rd
- 61 Sawmill Ln
- 61 Sawmill Ln Unit 61
- 170 Elm St
- 161 Winter St Unit 11
- 318 South St
- 26 Franklin St
- 1754 Central St
- 134 Crescent St
- 126-130 Franklin St
- 84 Liberty St
- 143 Plymouth St
- Lot 5 Princeton Way
- 269 Lakeside Rd
Your Personal Tour Guide
Ask me questions while you tour the home.