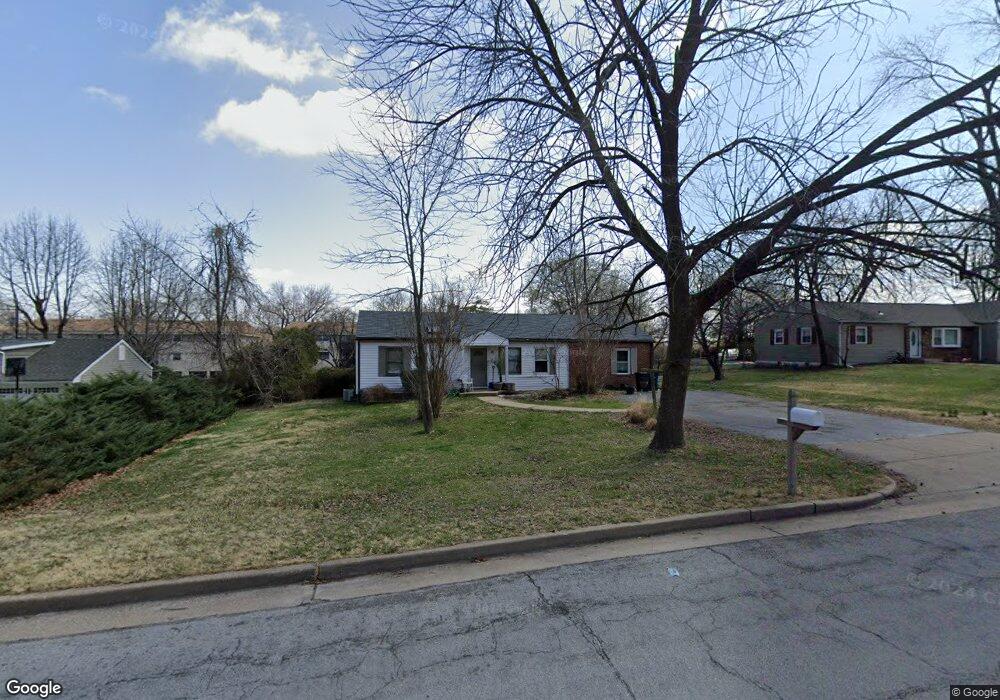
202 Hillsdale Dr Ballwin, MO 63011
Estimated Value: $227,864 - $277,000
3
Beds
1
Bath
1,325
Sq Ft
$185/Sq Ft
Est. Value
About This Home
This home is located at 202 Hillsdale Dr, Ballwin, MO 63011 and is currently estimated at $244,966, approximately $184 per square foot. 202 Hillsdale Dr is a home located in St. Louis County with nearby schools including Westridge Elementary School, Crestview Middle School, and Marquette Sr. High School.
Ownership History
Date
Name
Owned For
Owner Type
Purchase Details
Closed on
Sep 26, 2025
Sold by
Hero Homebuyers Llc
Bought by
Joni Realty Co
Current Estimated Value
Home Financials for this Owner
Home Financials are based on the most recent Mortgage that was taken out on this home.
Original Mortgage
$149,000
Outstanding Balance
$149,000
Interest Rate
6.58%
Mortgage Type
Credit Line Revolving
Estimated Equity
$95,966
Purchase Details
Closed on
Aug 28, 2025
Sold by
Brian G Spillers G and Brian Phyllis J
Bought by
Hero Homebuyers Llc
Home Financials for this Owner
Home Financials are based on the most recent Mortgage that was taken out on this home.
Original Mortgage
$149,000
Outstanding Balance
$149,000
Interest Rate
6.58%
Mortgage Type
Credit Line Revolving
Estimated Equity
$95,966
Purchase Details
Closed on
Nov 16, 2009
Sold by
Spillers Brian G and Spillers Phyllis J
Bought by
Spillers Brian G and Spillers Phyllis J
Purchase Details
Closed on
Nov 12, 2003
Sold by
Owens Amon E and Owens Mary Lou
Bought by
Spillers Brian G and Spillers Phyllis J
Create a Home Valuation Report for This Property
The Home Valuation Report is an in-depth analysis detailing your home's value as well as a comparison with similar homes in the area
Home Values in the Area
Average Home Value in this Area
Purchase History
| Date | Buyer | Sale Price | Title Company |
|---|---|---|---|
| Joni Realty Co | -- | True Title | |
| Hero Homebuyers Llc | -- | True Title | |
| Spillers Brian G | -- | None Available | |
| Spillers Brian G | $135,750 | -- |
Source: Public Records
Mortgage History
| Date | Status | Borrower | Loan Amount |
|---|---|---|---|
| Open | Joni Realty Co | $149,000 |
Source: Public Records
Tax History Compared to Growth
Tax History
| Year | Tax Paid | Tax Assessment Tax Assessment Total Assessment is a certain percentage of the fair market value that is determined by local assessors to be the total taxable value of land and additions on the property. | Land | Improvement |
|---|---|---|---|---|
| 2025 | $2,576 | $39,540 | $29,930 | $9,610 |
| 2024 | $2,576 | $36,640 | $21,380 | $15,260 |
| 2023 | $2,574 | $36,640 | $21,380 | $15,260 |
| 2022 | $2,446 | $32,320 | $23,520 | $8,800 |
| 2021 | $2,428 | $32,320 | $23,520 | $8,800 |
| 2020 | $2,311 | $29,320 | $17,860 | $11,460 |
| 2019 | $2,321 | $29,320 | $17,860 | $11,460 |
| 2018 | $2,027 | $24,110 | $14,060 | $10,050 |
| 2017 | $1,979 | $24,110 | $14,060 | $10,050 |
| 2016 | $1,677 | $19,590 | $9,960 | $9,630 |
| 2015 | $1,643 | $19,590 | $9,960 | $9,630 |
| 2014 | -- | $23,030 | $8,210 | $14,820 |
Source: Public Records
Map
Nearby Homes
- 160 Cumberland Park Ct Unit G
- 835 Portsdown Rd Unit C
- 138 Shadalane Walk Unit C
- 128 Shadalane Walk Unit A
- 811 Wendevy Ct Unit 16D
- 108 Hillsdale Dr
- 229 Mar el Ct
- 1040 Bridgeport Dr
- 105 Wren Trail Ct
- 192 Corral Trail
- 710 Kehrs Mill Rd
- 729 Redstart Dr
- 347 Meadowbrook Dr
- 948 Barbara Ann Ln
- 833 Twosome Ct
- 312 Clayton Crossing Dr Unit 304
- 611 Parker Dr
- 834 Westwood Dr
- 110 Coral Terrace Unit 6
- 220 Newton Place
- 124 Hillsdale Dr
- 204 Hillsdale Dr
- 149 Cumberland Park Ct Unit A
- 149 Cumberland Park Ct Unit D
- 149 Cumberland Park Ct Unit E
- 149 Cumberland Park Ct Unit C
- 149 Cumberland Park Ct Unit F
- 149 Cumberland Park Ct Unit H
- 149 Cumberland Park Ct Unit G
- 149 Cumberland Park Ct
- 122 Hillsdale Dr
- 161 Cumberland Park Ct Unit B
- 161 Cumberland Park Ct Unit G
- 161 Cumberland Park Ct Unit F
- 161 Cumberland Park Ct Unit C
- 161 Cumberland Park Ct Unit D
- 161 Cumberland Park Ct Unit H
- 161 Cumberland Park Ct Unit A
- 161 Cumberland Park Ct Unit E
- 907 Coronet Dr