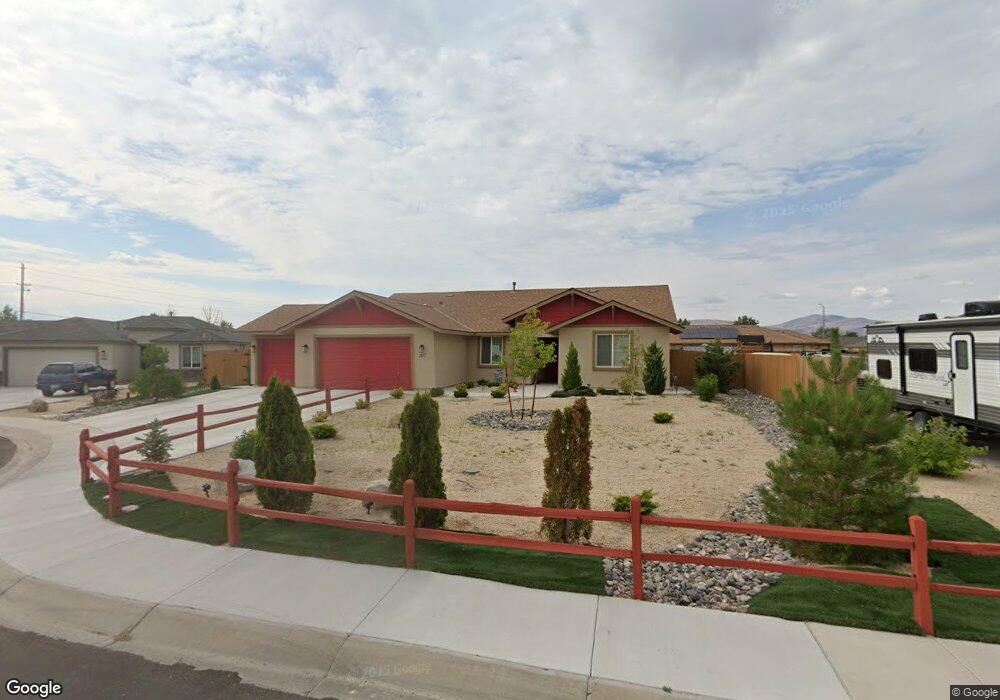
202 Jimmys Peak Ct Fernley, NV 89408
Estimated Value: $469,180 - $517,000
--
Bed
--
Bath
2,402
Sq Ft
$205/Sq Ft
Est. Value
About This Home
This home is located at 202 Jimmys Peak Ct, Fernley, NV 89408 and is currently estimated at $492,045, approximately $204 per square foot. 202 Jimmys Peak Ct is a home located in Lyon County with nearby schools including Cottonwood Elementary School, Fernley Intermediate School, and Fernley High School.
Ownership History
Date
Name
Owned For
Owner Type
Purchase Details
Closed on
Nov 29, 2021
Sold by
Innovative Custom Homes Llc
Bought by
Price Eva C and Price Richard M
Current Estimated Value
Home Financials for this Owner
Home Financials are based on the most recent Mortgage that was taken out on this home.
Original Mortgage
$100,000
Outstanding Balance
$79,107
Interest Rate
3.05%
Mortgage Type
New Conventional
Estimated Equity
$412,938
Purchase Details
Closed on
Apr 2, 2020
Sold by
Innovative Custom Homes Llc
Bought by
Innovative Custom Homes Llc
Home Financials for this Owner
Home Financials are based on the most recent Mortgage that was taken out on this home.
Original Mortgage
$1,450,000
Interest Rate
3.2%
Mortgage Type
Construction
Purchase Details
Closed on
Apr 9, 2009
Sold by
Lanza Joyce
Bought by
Lanza Joseph S
Create a Home Valuation Report for This Property
The Home Valuation Report is an in-depth analysis detailing your home's value as well as a comparison with similar homes in the area
Home Values in the Area
Average Home Value in this Area
Purchase History
| Date | Buyer | Sale Price | Title Company |
|---|---|---|---|
| Price Eva C | $386,473 | First American Title Sparks | |
| Innovative Custom Homes Llc | -- | First American Title Sparms | |
| Lanza Joseph S | -- | Western Title Company Inc |
Source: Public Records
Mortgage History
| Date | Status | Borrower | Loan Amount |
|---|---|---|---|
| Open | Price Eva C | $100,000 | |
| Previous Owner | Innovative Custom Homes Llc | $1,450,000 |
Source: Public Records
Tax History Compared to Growth
Tax History
| Year | Tax Paid | Tax Assessment Tax Assessment Total Assessment is a certain percentage of the fair market value that is determined by local assessors to be the total taxable value of land and additions on the property. | Land | Improvement |
|---|---|---|---|---|
| 2025 | $4,689 | $165,074 | $40,250 | $124,824 |
| 2024 | $4,962 | $165,028 | $40,250 | $124,778 |
| 2023 | $4,962 | $156,660 | $40,250 | $116,410 |
| 2022 | $4,656 | $147,374 | $40,250 | $107,124 |
| 2021 | $799 | $29,750 | $29,750 | $0 |
| 2020 | $590 | $29,750 | $29,750 | $0 |
| 2019 | $579 | $17,500 | $17,500 | $0 |
| 2018 | $566 | $12,950 | $12,950 | $0 |
| 2017 | $573 | $10,500 | $10,500 | $0 |
| 2016 | $472 | $7,350 | $7,350 | $0 |
| 2015 | $494 | $7,350 | $7,350 | $0 |
| 2014 | $490 | $7,350 | $7,350 | $0 |
Source: Public Records
Map
Nearby Homes
- 2605 Emerson Cir
- 1240-1250 Farm District Rd
- 1165 Farm Ln
- 1405 Buckboard Way
- 929 Jill Marie Ln
- 1034 Anthony Ln
- 1285 Camille Dr
- 465 Jennys Ln
- 965 Aster Ln
- 969 Kathryn Ct
- 955 Aster Ln
- 900 Jill Marie Ln
- 437 Trellis Dr
- 1165 Jenny's Ln
- 698 Jenny's Ln
- 675 Warren Way
- 1224 Mountain Rose Dr
- 1300 Rancho Rd
- 1563 Maria Ct
- 1409 Jennys Ln
- 202 Jimmy's Peak Ct
- 204 Jimmys Peak Ct
- 204 Jimmy's Peak Ct
- 200 Jimmys Peak Ct
- 200 Jimmy's Peak Ct
- 10 Lots Mountain View Dr
- 2525 Emerson Cir
- 2515 Emerson Cir
- 1 Mountain View Dr
- 13 Mountain View Dr
- 10 Mountain View Dr
- 97 Mountain View Dr
- 206 Jimmys Peak Ct
- 206 Jimmy's Peak Ct
- 205 Mountain View Dr
- 99 Mountain View Dr
- 2535 Emerson Cir
- 2505 Emerson Cir
- 208 Jimmy's Peak Ct
- 2510 Emerson Cir