Estimated Value: $262,000 - $285,000
3
Beds
2
Baths
1,623
Sq Ft
$169/Sq Ft
Est. Value
About This Home
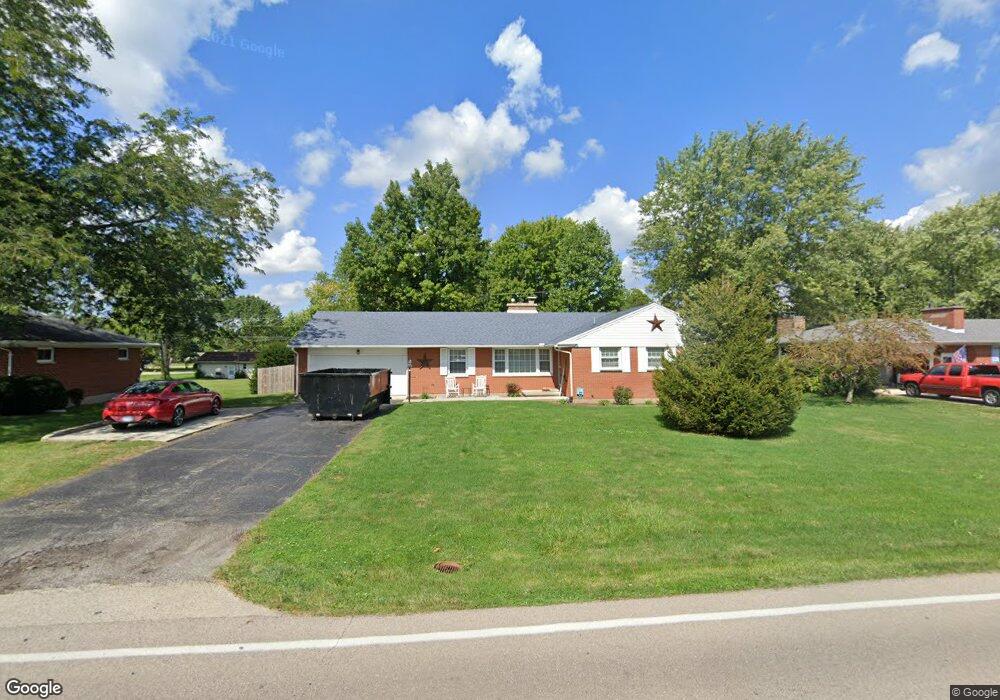
This home is located at 202 Kinsey Rd, Xenia, OH 45385 and is currently estimated at $274,315, approximately $169 per square foot. 202 Kinsey Rd is a home located in Greene County with nearby schools including Xenia High School, Summit Academy Community School for Alternative Learners - Xenia, and Legacy Christian Academy.
Ownership History
Date
Name
Owned For
Owner Type
Purchase Details
Closed on
Aug 21, 2025
Sold by
Pollock Joshua D and Pollock Jennifer L
Bought by
Pollock Jennifer L
Current Estimated Value
Purchase Details
Closed on
Jan 21, 2020
Sold by
Abbott Rebecka R and Abbott Brian K
Bought by
Pollock Joshua D and Pollock Jennifer L
Home Financials for this Owner
Home Financials are based on the most recent Mortgage that was taken out on this home.
Original Mortgage
$162,011
Interest Rate
3.62%
Mortgage Type
FHA
Purchase Details
Closed on
Apr 26, 2013
Sold by
Wolf Rebecka R and Abbott Rebecka R
Bought by
Abbott Rebecka R and Abbott Brian K
Purchase Details
Closed on
Dec 24, 2003
Sold by
Mcclellan Robert S and Mcclellan Frances L
Bought by
Wolf Don G and Wolf Rebecka R
Home Financials for this Owner
Home Financials are based on the most recent Mortgage that was taken out on this home.
Original Mortgage
$98,700
Interest Rate
4.37%
Mortgage Type
Unknown
Create a Home Valuation Report for This Property
The Home Valuation Report is an in-depth analysis detailing your home's value as well as a comparison with similar homes in the area
Home Values in the Area
Average Home Value in this Area
Purchase History
| Date | Buyer | Sale Price | Title Company |
|---|---|---|---|
| Pollock Jennifer L | -- | None Listed On Document | |
| Pollock Joshua D | $165,000 | Home Site Title Agency Inc | |
| Abbott Rebecka R | -- | None Available | |
| Wolf Rebecka R | -- | None Available | |
| Wolf Don G | $154,900 | -- |
Source: Public Records
Mortgage History
| Date | Status | Borrower | Loan Amount |
|---|---|---|---|
| Previous Owner | Pollock Joshua D | $162,011 | |
| Previous Owner | Wolf Don G | $98,700 |
Source: Public Records
Tax History Compared to Growth
Tax History
| Year | Tax Paid | Tax Assessment Tax Assessment Total Assessment is a certain percentage of the fair market value that is determined by local assessors to be the total taxable value of land and additions on the property. | Land | Improvement |
|---|---|---|---|---|
| 2024 | $3,474 | $73,260 | $13,400 | $59,860 |
| 2023 | $3,474 | $73,260 | $13,400 | $59,860 |
| 2022 | $2,865 | $54,800 | $11,170 | $43,630 |
| 2021 | $2,901 | $54,350 | $11,170 | $43,180 |
| 2020 | $2,317 | $54,350 | $11,170 | $43,180 |
| 2019 | $2,035 | $46,340 | $10,010 | $36,330 |
| 2018 | $2,042 | $46,340 | $10,010 | $36,330 |
| 2017 | $1,986 | $46,340 | $10,010 | $36,330 |
| 2016 | $1,918 | $43,480 | $10,010 | $33,470 |
| 2015 | $1,923 | $43,480 | $10,010 | $33,470 |
| 2014 | $1,845 | $43,480 | $10,010 | $33,470 |
Source: Public Records
Map
Nearby Homes
- 965 Oak Dale Dr
- 15 Sexton Dr
- 2018 Tahoe Dr
- 1359 Eagles Way
- 460 Kinsey Rd
- 1311 Eagles Way
- 983 Echo Ct
- 2094 Malibu Trail
- 2537 Ridge Rd
- 1968 El Camino Dr
- 1171 N Detroit St
- 1872 Harris Ln
- 1815 Promenade Ln
- 1038 Frederick Dr
- 493 Hollywood Blvd
- 499 Hollywood Blvd
- 1791 Palmer Ct
- 1820 Palmer Ct
- 1796 Palmer Ct
- 1802 Palmer Ct