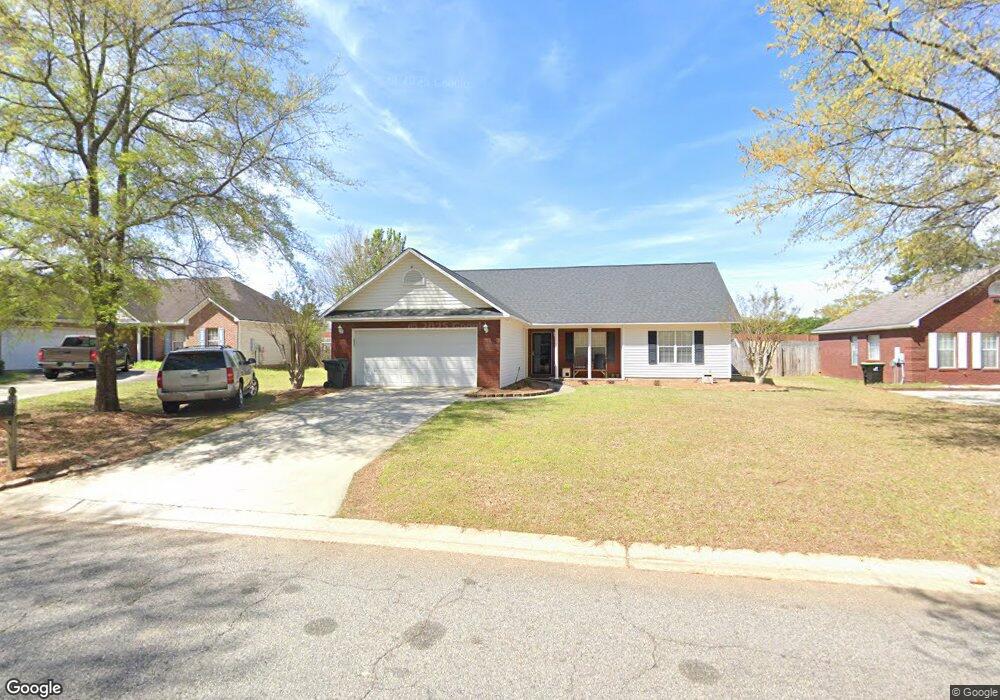
202 Knights Bridge Warner Robins, GA 31093
Estimated Value: $220,000 - $242,000
3
Beds
3
Baths
1,359
Sq Ft
$169/Sq Ft
Est. Value
About This Home
This home is located at 202 Knights Bridge, Warner Robins, GA 31093 and is currently estimated at $229,373, approximately $168 per square foot. 202 Knights Bridge is a home located in Houston County with nearby schools including Eagle Springs Elementary School, Thomson Middle School, and Northside High School.
Ownership History
Date
Name
Owned For
Owner Type
Purchase Details
Closed on
Oct 27, 2006
Sold by
Norris Sean P
Bought by
Norris Sean P and Norris Brandi Michele
Current Estimated Value
Purchase Details
Closed on
May 10, 2006
Sold by
Norris Sean P
Bought by
Norris Sean P and Norris Brandi Michele
Home Financials for this Owner
Home Financials are based on the most recent Mortgage that was taken out on this home.
Original Mortgage
$96,800
Outstanding Balance
$56,095
Interest Rate
6.41%
Mortgage Type
New Conventional
Estimated Equity
$173,278
Purchase Details
Closed on
Oct 30, 2003
Sold by
Pike Tina Gibbs and Pike Charles K
Bought by
Norris Sean P
Purchase Details
Closed on
Jun 6, 2001
Sold by
Gibbs Tina M
Bought by
Pike Tina Gibbs and Pike Charles K
Purchase Details
Closed on
Jun 4, 1999
Sold by
Chelsea Homes Inc
Bought by
Gibbs Tina M
Create a Home Valuation Report for This Property
The Home Valuation Report is an in-depth analysis detailing your home's value as well as a comparison with similar homes in the area
Home Values in the Area
Average Home Value in this Area
Purchase History
| Date | Buyer | Sale Price | Title Company |
|---|---|---|---|
| Norris Sean P | -- | First American Title Insuran | |
| Norris Sean P | -- | Title Source Inc | |
| Norris Sean P | $107,000 | -- | |
| Pike Tina Gibbs | -- | -- | |
| Gibbs Tina M | $90,700 | -- |
Source: Public Records
Mortgage History
| Date | Status | Borrower | Loan Amount |
|---|---|---|---|
| Open | Norris Sean P | $96,800 |
Source: Public Records
Tax History Compared to Growth
Tax History
| Year | Tax Paid | Tax Assessment Tax Assessment Total Assessment is a certain percentage of the fair market value that is determined by local assessors to be the total taxable value of land and additions on the property. | Land | Improvement |
|---|---|---|---|---|
| 2024 | $2,263 | $69,160 | $8,000 | $61,160 |
| 2023 | $2,130 | $64,600 | $8,000 | $56,600 |
| 2022 | $1,407 | $61,200 | $8,000 | $53,200 |
| 2021 | $1,131 | $48,920 | $8,000 | $40,920 |
| 2020 | $1,029 | $44,280 | $7,000 | $37,280 |
| 2019 | $1,029 | $44,280 | $7,000 | $37,280 |
| 2018 | $1,029 | $44,280 | $7,000 | $37,280 |
| 2017 | $1,030 | $44,280 | $7,000 | $37,280 |
| 2016 | $1,031 | $44,280 | $7,000 | $37,280 |
| 2015 | -- | $44,280 | $7,000 | $37,280 |
| 2014 | $436 | $44,280 | $7,000 | $37,280 |
| 2013 | $436 | $43,560 | $7,000 | $36,560 |
Source: Public Records
Map
Nearby Homes
- 32 Willow Lake Dr
- 106 Mayfair Cir
- 202 Fall Harvest
- 134 Williamstown Dr
- 0 Gunn Rd Unit 10620588
- 310 London Ct
- 236 Beau Claire Cir
- 238 Beau Claire Cir
- 240 Beau Claire Cir
- 506 Eagle Springs Dr
- 113 Westoak Ct
- 115 Pembroke Point
- 310 Beau Claire Cir
- 312 Beau Claire Cir
- 302 Beau Claire Cir
- 417 Covington Cove
- 109 Oldfield Ct
- 204 Knights Bridge
- 200 Knights Bridge
- 152 Knights Bridge
- 206 Knights Bridge
- 201 Knights Bridge
- 4 Leyland Place
- 141 Knights Bridge
- 203 Knights Bridge
- 203 Knights Bridge Unit 60
- 208 Knights Bridge
- 150 Knights Bridge
- 103 Wetherby Ct
- 3 Leyland Place
- 102 Wetherby Ct
- 210 Knights Bridge
- 105 Wetherby Ct
- 139 Knights Bridge
- 205 Knights Bridge
- 0 Wetherby Ct Unit 7419300
- 0 Wetherby Ct Unit 8048480