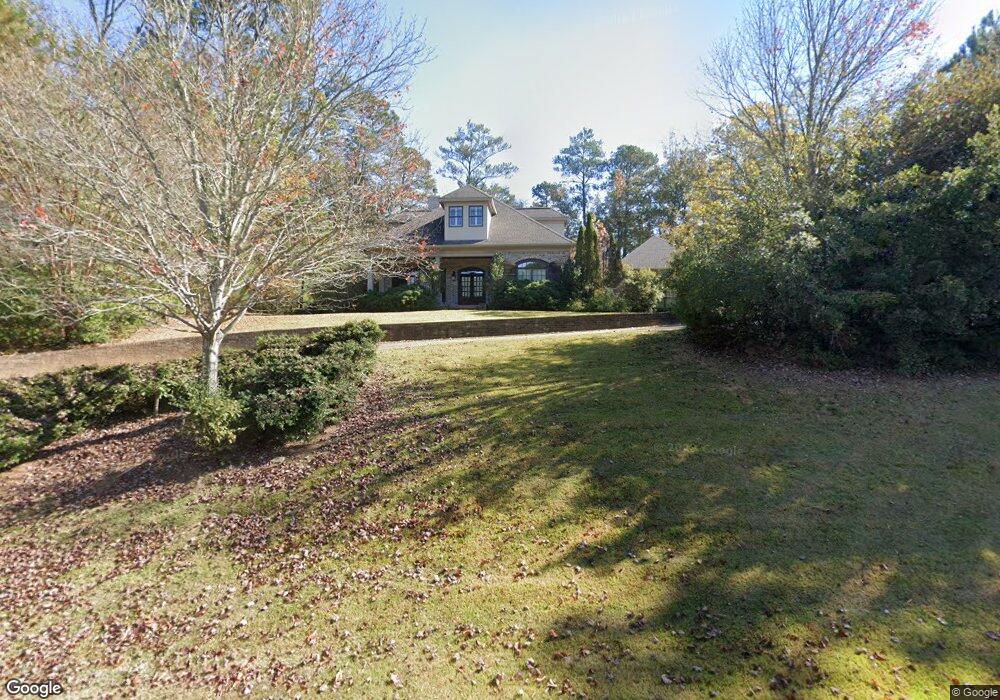
202 Lakeshore Dr Lagrange, GA 30240
Estimated Value: $830,995 - $1,099,000
4
Beds
4
Baths
3,659
Sq Ft
$267/Sq Ft
Est. Value
About This Home
This home is located at 202 Lakeshore Dr, Lagrange, GA 30240 and is currently estimated at $976,665, approximately $266 per square foot. 202 Lakeshore Dr is a home located in Troup County with nearby schools including Hollis Hand Elementary School, Ethel W. Kight Elementary School, and Franklin Forest Elementary School.
Ownership History
Date
Name
Owned For
Owner Type
Purchase Details
Closed on
Apr 14, 2008
Sold by
Hillberg James L
Bought by
Yasufuku Takuya
Current Estimated Value
Purchase Details
Closed on
Jul 28, 2005
Sold by
Signature Homes By Defores
Bought by
Hillberg James L and Hillberg Mary Ann G
Home Financials for this Owner
Home Financials are based on the most recent Mortgage that was taken out on this home.
Original Mortgage
$350,000
Interest Rate
5.25%
Mortgage Type
New Conventional
Purchase Details
Closed on
May 5, 2003
Sold by
Ida Cason Callaway Hudson
Bought by
Signature Homes By Deforest Wi
Purchase Details
Closed on
Dec 17, 2002
Sold by
Easement
Bought by
Ida Cason Callaway Hudson
Purchase Details
Closed on
Dec 16, 2002
Sold by
Fuller E Callaway
Bought by
Easement
Purchase Details
Closed on
Aug 12, 1998
Sold by
Callaway Fuller Est
Bought by
Fuller E Callaway
Create a Home Valuation Report for This Property
The Home Valuation Report is an in-depth analysis detailing your home's value as well as a comparison with similar homes in the area
Purchase History
| Date | Buyer | Sale Price | Title Company |
|---|---|---|---|
| Yasufuku Takuya | $650,000 | -- | |
| Hillberg James L | $645,000 | -- | |
| Signature Homes By Deforest Wi | -- | -- | |
| Ida Cason Callaway Hudson | -- | -- | |
| Easement | $160,000 | -- | |
| Fuller E Callaway | -- | -- |
Source: Public Records
Mortgage History
| Date | Status | Borrower | Loan Amount |
|---|---|---|---|
| Previous Owner | Hillberg James L | $350,000 |
Source: Public Records
Tax History
| Year | Tax Paid | Tax Assessment Tax Assessment Total Assessment is a certain percentage of the fair market value that is determined by local assessors to be the total taxable value of land and additions on the property. | Land | Improvement |
|---|---|---|---|---|
| 2025 | $9,049 | $331,800 | $75,000 | $256,800 |
| 2024 | $8,594 | $315,120 | $75,000 | $240,120 |
| 2023 | $7,300 | $267,680 | $60,000 | $207,680 |
| 2022 | $7,072 | $253,400 | $60,000 | $193,400 |
| 2021 | $7,534 | $249,800 | $60,000 | $189,800 |
| 2020 | $7,534 | $249,800 | $60,000 | $189,800 |
| 2019 | $7,593 | $251,760 | $60,000 | $191,760 |
| 2018 | $7,318 | $242,640 | $60,000 | $182,640 |
| 2017 | $7,318 | $242,640 | $60,000 | $182,640 |
| 2016 | $7,153 | $237,165 | $60,000 | $177,165 |
| 2015 | $7,165 | $237,165 | $60,000 | $177,165 |
| 2014 | $7,066 | $233,512 | $60,000 | $173,512 |
| 2013 | -- | $237,080 | $60,000 | $177,080 |
Source: Public Records
Map
Nearby Homes
- 106 Highland Park
- 116 Deal Dr
- 101 Deal Dr
- 638 Cameron Mill Rd
- 1784 Mooty Bridge Rd
- 217 Baywood Cir
- 732 Camellia Dr
- 0 Hills and Dales Farm Rd
- 724 Camellia Dr
- 1000 Foxcroft Dr
- 102 Beech Creek Dr
- 100 Deer Creek Dr
- 110 Pond View Point
- 127 Ashling Dr
- 106 Ewing St
- 2010 Foxcroft Dr
- 420 Ridgecrest Rd
- 103 Powers Ct
- 204 Dixie Creek Dr
- 2005 Foxcroft Dr
- 200 Lakeshore Dr
- 312 Saint Andrews Ct
- 314 Saint Andrews Ct
- 310 Saint Andrews Ct
- 204 Lakeshore Dr
- 308 Saint Andrews Ct
- 206 Lakeshore Dr
- 211 Lakeshore Dr
- 209 Lakeshore Dr
- 207 Lakeshore Dr
- 304 Saint Andrews Ct
- 208 Lakeshore Dr
- 101 Lakeshore Point
- 302 St Andrews
- 302 Saint Andrews Ct
- 203 Lakeshore Dr
- 403 Highlander Run Unit 9
- 403 Highlander Run
- 405 Highlander Run Unit 10
- 405 Highlander Run
Your Personal Tour Guide
Ask me questions while you tour the home.