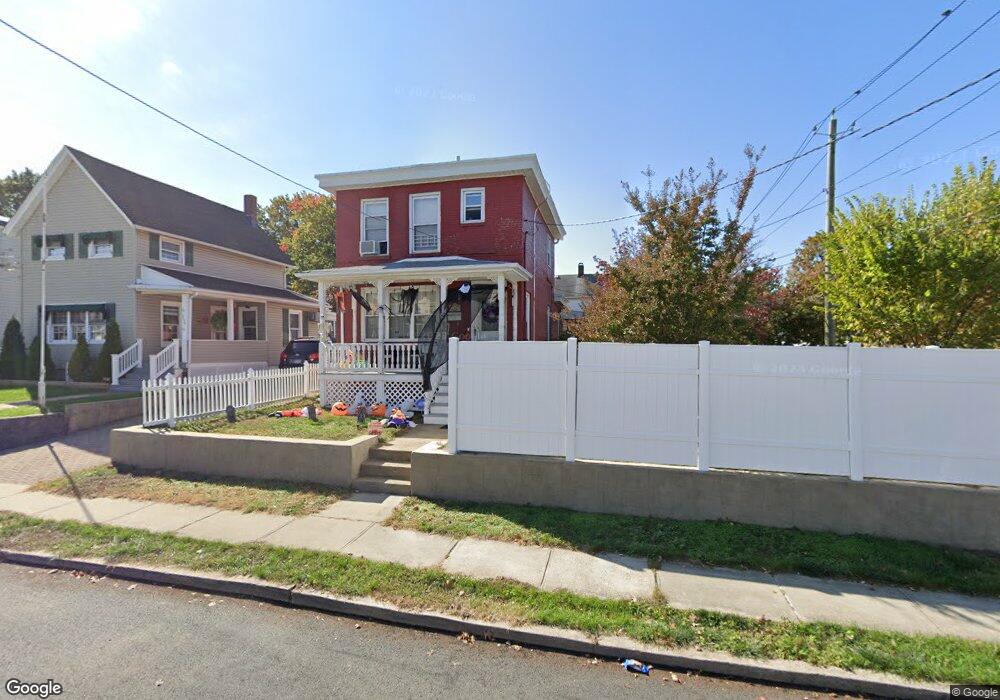
202 Lee Ave Staten Island, NY 10307
Tottenville NeighborhoodEstimated Value: $599,302 - $635,000
--
Bed
4
Baths
1,008
Sq Ft
$612/Sq Ft
Est. Value
About This Home
This home is located at 202 Lee Ave, Staten Island, NY 10307 and is currently estimated at $616,576, approximately $611 per square foot. 202 Lee Ave is a home located in Richmond County with nearby schools including P.S. 1 Tottenville, Is 34 Tottenville, and Tottenville High School.
Ownership History
Date
Name
Owned For
Owner Type
Purchase Details
Closed on
Apr 21, 2022
Sold by
Lynn App
Bought by
Rizzo Victoria and Herlein Ronald William
Current Estimated Value
Home Financials for this Owner
Home Financials are based on the most recent Mortgage that was taken out on this home.
Original Mortgage
$522,460
Interest Rate
4.42%
Mortgage Type
FHA
Purchase Details
Closed on
Sep 14, 2005
Sold by
Pierce Perry Thomas and Pierce Nancy
Bought by
App Lynn and Pierce Joseph
Create a Home Valuation Report for This Property
The Home Valuation Report is an in-depth analysis detailing your home's value as well as a comparison with similar homes in the area
Home Values in the Area
Average Home Value in this Area
Purchase History
| Date | Buyer | Sale Price | Title Company |
|---|---|---|---|
| Rizzo Victoria | $540,500 | First American Title | |
| App Lynn | -- | Washington Title Ins Co |
Source: Public Records
Mortgage History
| Date | Status | Borrower | Loan Amount |
|---|---|---|---|
| Previous Owner | Rizzo Victoria | $522,460 |
Source: Public Records
Tax History Compared to Growth
Tax History
| Year | Tax Paid | Tax Assessment Tax Assessment Total Assessment is a certain percentage of the fair market value that is determined by local assessors to be the total taxable value of land and additions on the property. | Land | Improvement |
|---|---|---|---|---|
| 2025 | $5,440 | $36,660 | $10,661 | $25,999 |
| 2024 | $3,495 | $35,760 | $10,634 | $25,126 |
| 2023 | $3,245 | $25,560 | $9,789 | $15,771 |
| 2022 | $2,616 | $34,980 | $14,040 | $20,940 |
| 2021 | $3,977 | $31,440 | $14,040 | $17,400 |
| 2020 | $4,005 | $27,120 | $14,040 | $13,080 |
| 2019 | $3,827 | $29,400 | $14,040 | $15,360 |
| 2018 | $3,096 | $21,300 | $14,040 | $7,260 |
| 2017 | $3,084 | $20,420 | $11,827 | $8,593 |
| 2016 | $3,001 | $19,347 | $11,432 | $7,915 |
| 2015 | $2,777 | $19,332 | $10,530 | $8,802 |
| 2014 | $2,777 | $18,810 | $10,160 | $8,650 |
Source: Public Records
Map
Nearby Homes