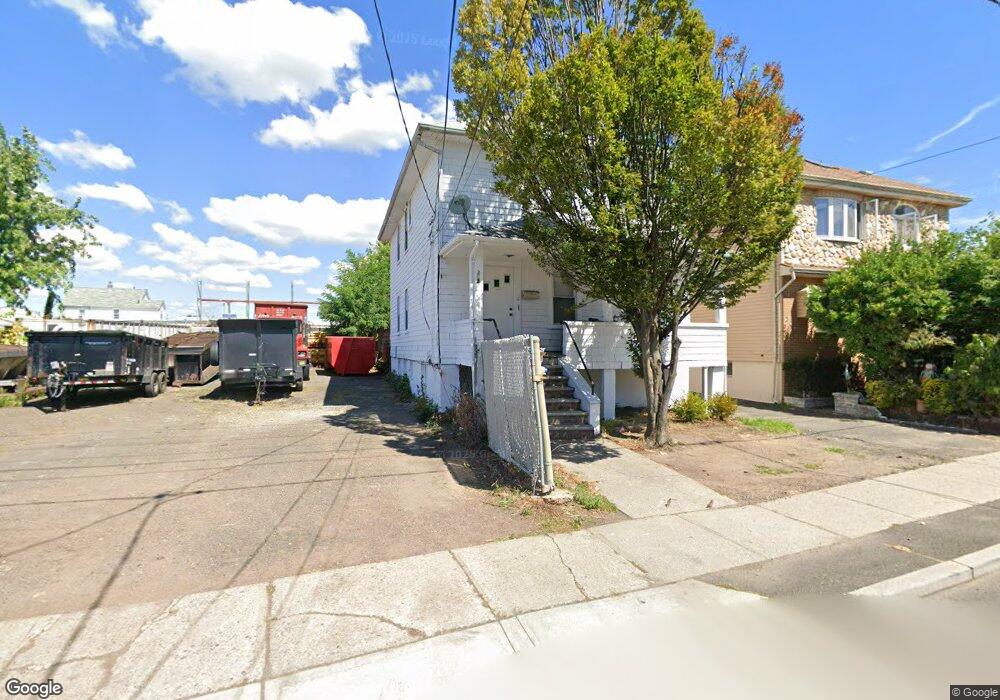
202 Lodi St Hackensack, NJ 07601
Estimated Value: $459,000 - $609,000
Studio
--
Bath
1,824
Sq Ft
$304/Sq Ft
Est. Value
About This Home
This home is located at 202 Lodi St, Hackensack, NJ 07601 and is currently estimated at $554,253, approximately $303 per square foot. 202 Lodi St is a home located in Bergen County with nearby schools including Hackensack High School and George Washington School.
Ownership History
Date
Name
Owned For
Owner Type
Purchase Details
Closed on
Oct 5, 2020
Sold by
Lee Nelson and Wyszatycki Joanna E
Bought by
202 Lodi Street Llc
Current Estimated Value
Purchase Details
Closed on
Aug 29, 2002
Sold by
202 Lodi Street Llc
Bought by
Lee Nelson and Wyszatycki Joana
Home Financials for this Owner
Home Financials are based on the most recent Mortgage that was taken out on this home.
Original Mortgage
$180,000
Interest Rate
6.36%
Purchase Details
Closed on
Mar 23, 2001
Sold by
Siervo Assoc Llc
Bought by
202 Lodi Street Llc
Home Financials for this Owner
Home Financials are based on the most recent Mortgage that was taken out on this home.
Original Mortgage
$180,000
Interest Rate
6.88%
Purchase Details
Closed on
Nov 16, 2000
Sold by
Siervo Michael
Bought by
Siervo Assoc Llc
Create a Home Valuation Report for This Property
The Home Valuation Report is an in-depth analysis detailing your home's value as well as a comparison with similar homes in the area
Home Values in the Area
Average Home Value in this Area
Purchase History
| Date | Buyer | Sale Price | Title Company |
|---|---|---|---|
| 202 Lodi Street Llc | -- | None Available | |
| Lee Nelson | $180,000 | -- | |
| 202 Lodi Street Llc | $240,000 | -- | |
| Siervo Assoc Llc | $124,200 | -- | |
| Siervo Assoc Llc | $124,200 | -- |
Source: Public Records
Mortgage History
| Date | Status | Borrower | Loan Amount |
|---|---|---|---|
| Previous Owner | Lee Nelson | $180,000 | |
| Previous Owner | 202 Lodi Street Llc | $180,000 |
Source: Public Records
Tax History
| Year | Tax Paid | Tax Assessment Tax Assessment Total Assessment is a certain percentage of the fair market value that is determined by local assessors to be the total taxable value of land and additions on the property. | Land | Improvement |
|---|---|---|---|---|
| 2025 | $9,642 | $315,500 | $145,400 | $170,100 |
| 2024 | $9,083 | $315,500 | $145,400 | $170,100 |
| 2023 | $8,616 | $315,500 | $145,400 | $170,100 |
| 2022 | $8,616 | $307,500 | $138,400 | $169,100 |
| 2021 | $8,670 | $258,200 | $124,000 | $134,200 |
| 2020 | $8,544 | $258,200 | $124,000 | $134,200 |
| 2019 | $8,533 | $254,200 | $122,100 | $132,100 |
| 2018 | $8,539 | $250,200 | $119,200 | $131,000 |
| 2017 | $8,408 | $246,200 | $117,300 | $128,900 |
| 2016 | $7,766 | $229,900 | $103,100 | $126,800 |
| 2015 | $7,235 | $206,700 | $129,800 | $76,900 |
| 2014 | $6,867 | $206,700 | $129,800 | $76,900 |
Source: Public Records
Map
Nearby Homes
- 75 Cleveland St
- 115 Kansas St
- 113 Kansas St
- 99 Kansas St
- 115 Polifly Rd Unit 4F
- 115 Polifly Rd Unit 5D
- 84 Kansas St
- 39 Union St Unit 105
- 110 Sussex St Unit 2F
- 75 Union St Unit 5E
- 74 Union St
- 311 Marvin Ave
- 279 Clark St Unit A-7
- 378 Marvin Ave
- 72 Lawrence St
- 229 Baldwin Ave
- 314 Atlantic St
- 337 Hudson St
- 301 Beech St Unit 12E
- 301 Beech St Unit 10I
Your Personal Tour Guide
Ask me questions while you tour the home.