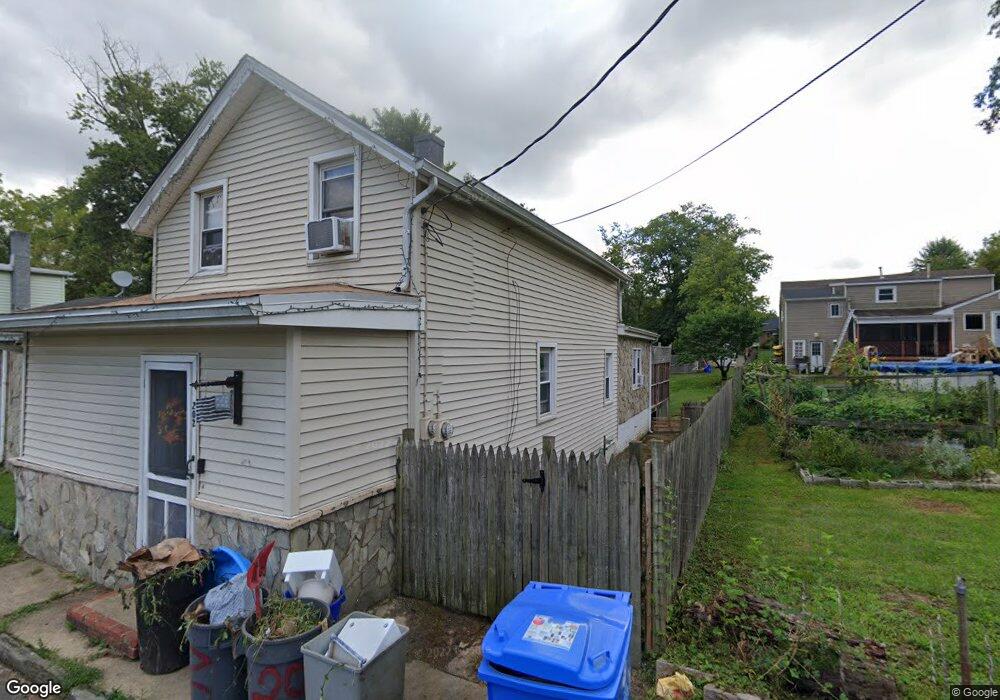
202 Lyons Ln Fieldsboro, NJ 08505
Estimated Value: $337,000 - $382,000
Studio
--
Bath
1,526
Sq Ft
$232/Sq Ft
Est. Value
About This Home
This home is located at 202 Lyons Ln, Fieldsboro, NJ 08505 and is currently estimated at $353,959, approximately $231 per square foot. 202 Lyons Ln is a home located in Burlington County with nearby schools including Bordentown Reg High School and Riverbank Charter School of Excellence.
Ownership History
Date
Name
Owned For
Owner Type
Purchase Details
Closed on
Sep 29, 2006
Sold by
Louis Jean Dawn and Louis Jean Claude
Bought by
Zdrojewski John J and Zdrojewski Danielle R
Current Estimated Value
Home Financials for this Owner
Home Financials are based on the most recent Mortgage that was taken out on this home.
Original Mortgage
$40,000
Outstanding Balance
$3,448
Interest Rate
6.47%
Mortgage Type
Stand Alone Second
Estimated Equity
$350,511
Create a Home Valuation Report for This Property
The Home Valuation Report is an in-depth analysis detailing your home's value as well as a comparison with similar homes in the area
Home Values in the Area
Average Home Value in this Area
Purchase History
| Date | Buyer | Sale Price | Title Company |
|---|---|---|---|
| Zdrojewski John J | $200,000 | Congress Title |
Source: Public Records
Mortgage History
| Date | Status | Borrower | Loan Amount |
|---|---|---|---|
| Open | Zdrojewski John J | $40,000 | |
| Open | Zdrojewski John J | $160,000 |
Source: Public Records
Tax History
| Year | Tax Paid | Tax Assessment Tax Assessment Total Assessment is a certain percentage of the fair market value that is determined by local assessors to be the total taxable value of land and additions on the property. | Land | Improvement |
|---|---|---|---|---|
| 2025 | $5,548 | $183,700 | $70,200 | $113,500 |
| 2024 | $5,346 | $183,700 | $70,200 | $113,500 |
| 2023 | $5,346 | $183,700 | $70,200 | $113,500 |
| 2022 | $5,414 | $183,700 | $70,200 | $113,500 |
| 2021 | $5,535 | $183,700 | $70,200 | $113,500 |
| 2020 | $5,298 | $183,700 | $70,200 | $113,500 |
| 2019 | $5,278 | $183,700 | $70,200 | $113,500 |
| 2018 | $5,298 | $183,700 | $70,200 | $113,500 |
| 2017 | $5,011 | $183,700 | $70,200 | $113,500 |
| 2016 | $4,844 | $183,700 | $70,200 | $113,500 |
| 2015 | $5,076 | $196,300 | $70,200 | $126,100 |
| 2014 | $4,866 | $196,300 | $70,200 | $126,100 |
Source: Public Records
Map
Nearby Homes
- 213 Front St
- 202 Union St
- 212 River Ct
- 229 Washington St
- 43 Allegheny Ln
- 59 Seneca Ln
- 43 Meadow Run Rd
- 422 Prince St
- 365 Prince St
- 514 Prince St
- 6 W Church St
- 39 Tantum Ct
- 600 Farnsworth Ave
- 319 Borden St
- 310 Hopkinson St
- 51 Mary St
- 70 E Park St Unit 1-11
- 124 E Burlington St
- 10 Roberts Ct
- 13 Ticonderoga Dr
Your Personal Tour Guide
Ask me questions while you tour the home.