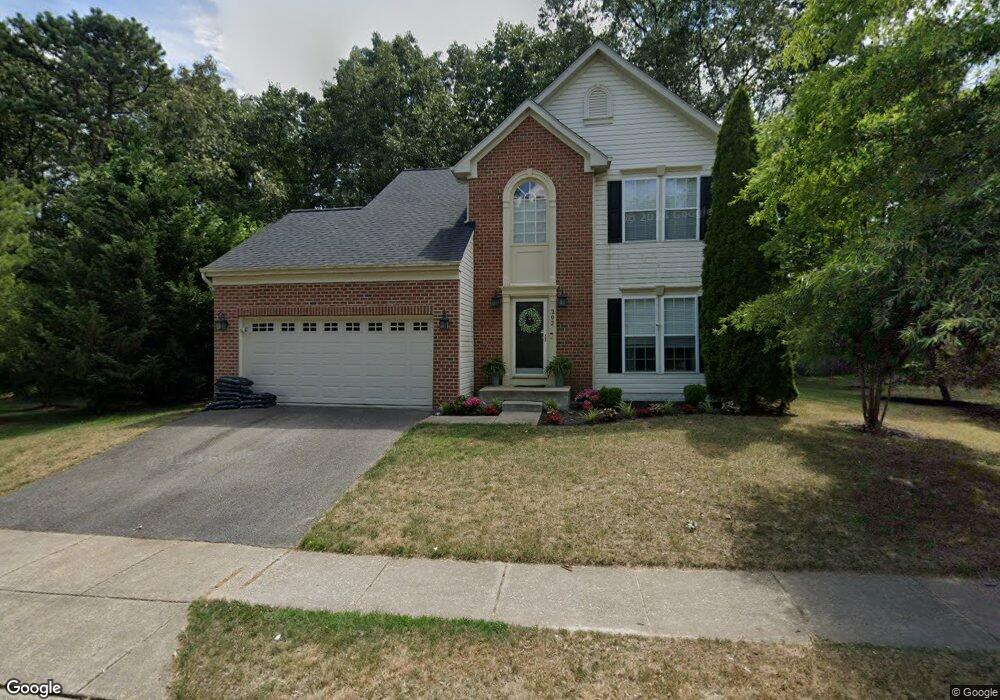
202 Mall Rd Glen Burnie, MD 21061
Estimated Value: $546,303 - $569,000
3
Beds
3
Baths
1,796
Sq Ft
$311/Sq Ft
Est. Value
About This Home
This home is located at 202 Mall Rd, Glen Burnie, MD 21061 and is currently estimated at $557,826, approximately $310 per square foot. 202 Mall Rd is a home located in Anne Arundel County with nearby schools including Southgate Elementary School, Old Mill Middle School North, and Old Mill High School.
Ownership History
Date
Name
Owned For
Owner Type
Purchase Details
Closed on
Jun 28, 2021
Sold by
Brown Cathy Lynn and Tippett Michael R
Bought by
Brown Cathy Lynn
Current Estimated Value
Home Financials for this Owner
Home Financials are based on the most recent Mortgage that was taken out on this home.
Original Mortgage
$310,500
Outstanding Balance
$281,297
Interest Rate
2.8%
Mortgage Type
New Conventional
Estimated Equity
$276,529
Purchase Details
Closed on
Jan 31, 2013
Sold by
Brown Cathy Lynn and Tippett Michael R
Bought by
Brown Cathy Lynn and Tippett Michael R
Home Financials for this Owner
Home Financials are based on the most recent Mortgage that was taken out on this home.
Original Mortgage
$365,800
Interest Rate
3.38%
Mortgage Type
New Conventional
Purchase Details
Closed on
May 19, 2004
Sold by
Jin Huiqin
Bought by
Brown Cathy L and Tippett Michael R
Purchase Details
Closed on
Oct 15, 2001
Sold by
Nvr Inc
Bought by
Jin Huiqin and Zai Yingkai
Create a Home Valuation Report for This Property
The Home Valuation Report is an in-depth analysis detailing your home's value as well as a comparison with similar homes in the area
Home Values in the Area
Average Home Value in this Area
Purchase History
| Date | Buyer | Sale Price | Title Company |
|---|---|---|---|
| Brown Cathy Lynn | -- | Accommodation | |
| Brown Cathy Lynn | -- | None Available | |
| Brown Cathy L | $357,000 | -- | |
| Jin Huiqin | $215,565 | -- |
Source: Public Records
Mortgage History
| Date | Status | Borrower | Loan Amount |
|---|---|---|---|
| Open | Brown Cathy Lynn | $310,500 | |
| Closed | Brown Cathy Lynn | $365,800 | |
| Closed | Jin Huiqin | -- |
Source: Public Records
Tax History Compared to Growth
Tax History
| Year | Tax Paid | Tax Assessment Tax Assessment Total Assessment is a certain percentage of the fair market value that is determined by local assessors to be the total taxable value of land and additions on the property. | Land | Improvement |
|---|---|---|---|---|
| 2025 | $4,417 | $453,200 | -- | -- |
| 2024 | $4,417 | $414,800 | $167,500 | $247,300 |
| 2023 | $4,302 | $407,467 | $0 | $0 |
| 2022 | $4,026 | $400,133 | $0 | $0 |
| 2021 | $7,912 | $392,800 | $157,300 | $235,500 |
| 2020 | $3,846 | $384,600 | $0 | $0 |
| 2019 | $7,401 | $376,400 | $0 | $0 |
| 2018 | $3,734 | $368,200 | $136,800 | $231,400 |
| 2017 | $3,484 | $344,900 | $0 | $0 |
| 2016 | -- | $321,600 | $0 | $0 |
| 2015 | -- | $298,300 | $0 | $0 |
| 2014 | -- | $298,300 | $0 | $0 |
Source: Public Records
Map
Nearby Homes
- 219 Mall Rd
- 8331 Elvaton Rd
- 90 Foxchase Ct
- 8345 Elvaton Rd
- 220 Foxtree Dr
- 221 Foxmanor Ln
- 8304 Patience Ln
- 8318 Elvaton Rd
- 219 Cabernet St
- 8381 Amber Beacon Cir
- 268 Glenda Ct
- 7911 Ritchie Hwy
- 248 Michele Cir
- 258 Nathan Way
- 266 Nathan Way
- 8163 Ritchie Hwy
- 100 Sandsbury Ave
- 1109 Castle Harbour Way Unit 2D
- 221 Gunther Place
- 8234 White Star Crossing
- 8103 Huntmaster Ct
- 8101 Huntmaster Ct
- 8105 Huntmaster Ct
- 203 Mall Rd
- 8107 Huntmaster Ct
- 48 Foxwell Bend Rd
- 8109 Huntmaster Ct
- 210 Mall Rd
- 8032 Little Fox Ct
- 8100 Huntmaster Ct
- 8034 Little Fox Ct
- 8104 Huntmaster Ct
- 8030 Little Fox Ct
- 47 Foxwell Bend Rd
- 8106 Huntmaster Ct
- 8102 Huntmaster Ct
- 8035 Little Fox Ct
- 8108 Huntmaster Ct
- 8033 Merry Chase Ct
- 8028 Merry Chase Ct