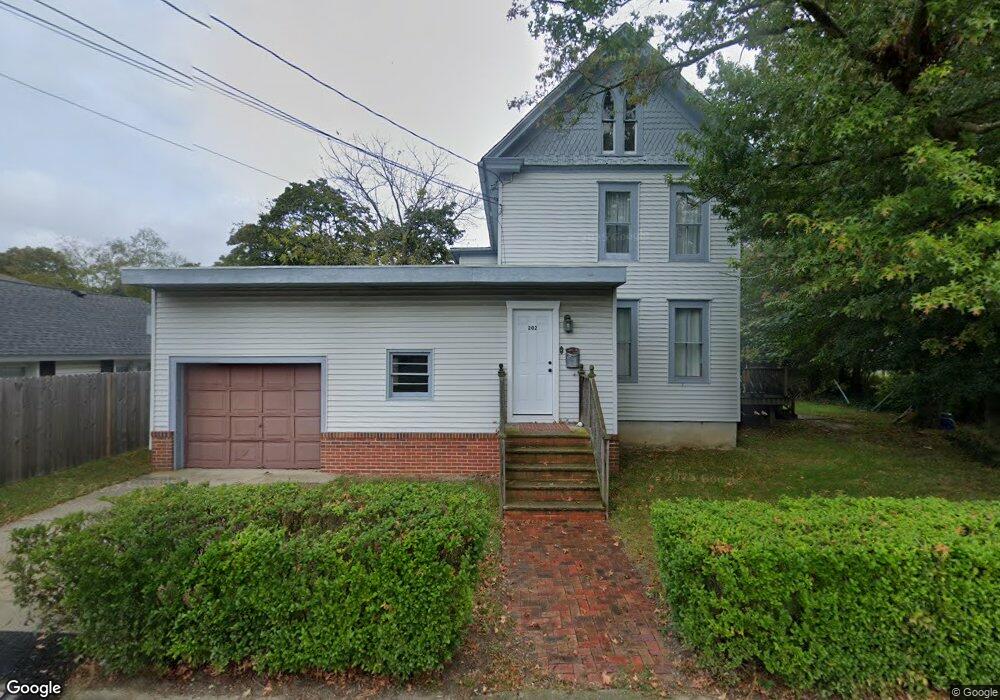
202 Mechanic St Cape May Court House, NJ 08210
Estimated Value: $302,054 - $550,000
--
Bed
--
Bath
1,643
Sq Ft
$250/Sq Ft
Est. Value
About This Home
This home is located at 202 Mechanic St, Cape May Court House, NJ 08210 and is currently estimated at $410,014, approximately $249 per square foot. 202 Mechanic St is a home located in Cape May County with nearby schools including Middle Township Elementary No. 1, Middle Township Elementary No. 2, and Middle Township Middle School.
Ownership History
Date
Name
Owned For
Owner Type
Purchase Details
Closed on
Feb 16, 2022
Sold by
Anthony Devico Iii and Anthony Jeanne N
Bought by
Devico Dominic
Current Estimated Value
Home Financials for this Owner
Home Financials are based on the most recent Mortgage that was taken out on this home.
Original Mortgage
$140,000
Outstanding Balance
$111,687
Interest Rate
2.8%
Mortgage Type
Seller Take Back
Estimated Equity
$298,327
Purchase Details
Closed on
Aug 12, 1985
Bought by
Devico Anthony and Devico Jeanne N
Create a Home Valuation Report for This Property
The Home Valuation Report is an in-depth analysis detailing your home's value as well as a comparison with similar homes in the area
Home Values in the Area
Average Home Value in this Area
Purchase History
| Date | Buyer | Sale Price | Title Company |
|---|---|---|---|
| Devico Dominic | $150,000 | Shore Title | |
| Devico Dominic | $150,000 | Shore Title | |
| Devico Anthony | -- | -- |
Source: Public Records
Mortgage History
| Date | Status | Borrower | Loan Amount |
|---|---|---|---|
| Open | Devico Dominic | $140,000 | |
| Closed | Devico Dominic | $140,000 |
Source: Public Records
Tax History Compared to Growth
Tax History
| Year | Tax Paid | Tax Assessment Tax Assessment Total Assessment is a certain percentage of the fair market value that is determined by local assessors to be the total taxable value of land and additions on the property. | Land | Improvement |
|---|---|---|---|---|
| 2025 | $4,355 | $206,500 | $126,800 | $79,700 |
| 2024 | $4,355 | $206,500 | $126,800 | $79,700 |
| 2023 | $4,246 | $206,500 | $126,800 | $79,700 |
| 2022 | $4,124 | $206,500 | $126,800 | $79,700 |
| 2021 | $4,025 | $206,500 | $126,800 | $79,700 |
| 2020 | $3,942 | $206,500 | $126,800 | $79,700 |
| 2019 | $3,841 | $206,500 | $126,800 | $79,700 |
| 2018 | $3,781 | $206,500 | $126,800 | $79,700 |
| 2017 | $3,705 | $206,500 | $126,800 | $79,700 |
| 2016 | $3,612 | $206,500 | $126,800 | $79,700 |
| 2015 | $3,585 | $206,500 | $126,800 | $79,700 |
| 2014 | $3,562 | $206,500 | $126,800 | $79,700 |
Source: Public Records
Map
Nearby Homes