202 Merrybrook Dr Lagrange, GA 30241
Estimated Value: $199,971 - $223,000
3
Beds
2
Baths
1,224
Sq Ft
$173/Sq Ft
Est. Value
About This Home
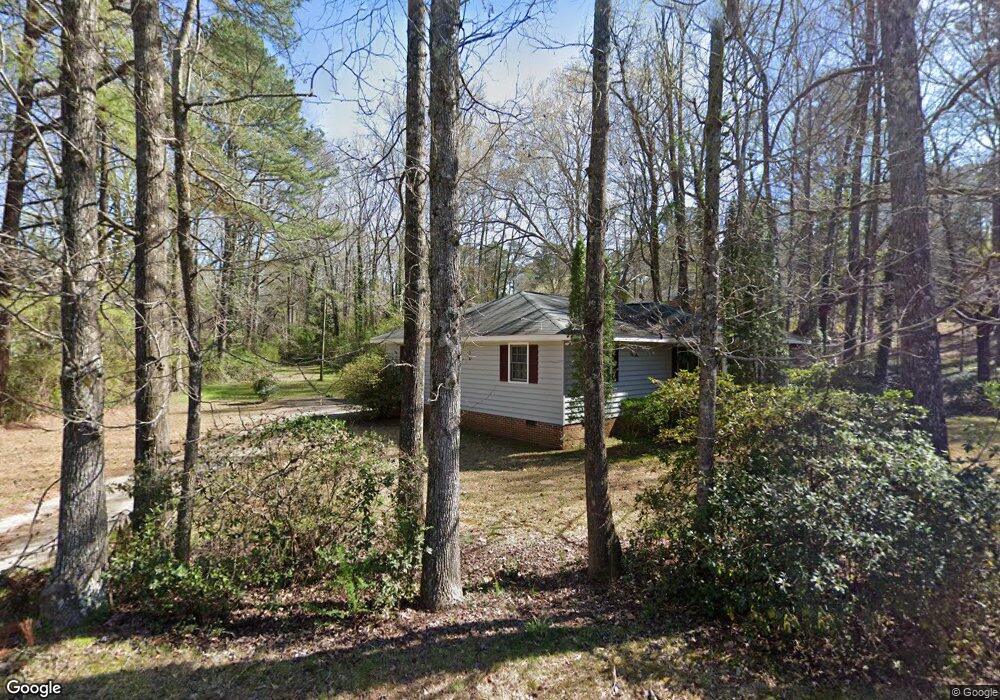
This home is located at 202 Merrybrook Dr, Lagrange, GA 30241 and is currently estimated at $211,743, approximately $172 per square foot. 202 Merrybrook Dr is a home located in Troup County with nearby schools including Franklin Forest Elementary School, Hollis Hand Elementary School, and Ethel W. Kight Elementary School.
Ownership History
Date
Name
Owned For
Owner Type
Purchase Details
Closed on
Oct 14, 1997
Sold by
John Joseph Alise
Bought by
Cammon Joseph L and Cammon Dorothy J
Current Estimated Value
Purchase Details
Closed on
Sep 1, 1987
Sold by
Dennis Cavender
Bought by
John Joseph Alise
Purchase Details
Closed on
Sep 1, 1986
Sold by
Edna J Hardin
Bought by
Dennis Cavender
Purchase Details
Closed on
Mar 1, 1986
Sold by
Douglas E Hardin
Bought by
Edna J Hardin
Purchase Details
Closed on
Apr 22, 1976
Sold by
Jessie L Barnes
Bought by
Michael A Duncan
Purchase Details
Closed on
Aug 1, 1975
Sold by
Jessie L Barnes
Bought by
Jessie L Barnes
Purchase Details
Closed on
Jan 1, 1974
Sold by
Peoples Bank Of Lagrange
Bought by
Jessie L Barnes
Purchase Details
Closed on
Jan 1, 1970
Bought by
Peoples Bank Of Lagrange
Create a Home Valuation Report for This Property
The Home Valuation Report is an in-depth analysis detailing your home's value as well as a comparison with similar homes in the area
Purchase History
| Date | Buyer | Sale Price | Title Company |
|---|---|---|---|
| Cammon Joseph L | $78,700 | -- | |
| John Joseph Alise | $4,000 | -- | |
| Dennis Cavender | -- | -- | |
| Edna J Hardin | -- | -- | |
| Michael A Duncan | -- | -- | |
| Jessie L Barnes | -- | -- | |
| Jessie L Barnes | -- | -- | |
| Peoples Bank Of Lagrange | -- | -- |
Source: Public Records
Tax History
| Year | Tax Paid | Tax Assessment Tax Assessment Total Assessment is a certain percentage of the fair market value that is determined by local assessors to be the total taxable value of land and additions on the property. | Land | Improvement |
|---|---|---|---|---|
| 2025 | $1,317 | $57,592 | $10,000 | $47,592 |
| 2024 | $1,317 | $50,280 | $10,000 | $40,280 |
| 2023 | $1,228 | $47,004 | $10,000 | $37,004 |
| 2022 | $1,207 | $45,244 | $10,000 | $35,244 |
| 2021 | $1,111 | $38,812 | $8,000 | $30,812 |
| 2020 | $1,111 | $38,812 | $8,000 | $30,812 |
| 2019 | $975 | $34,308 | $4,000 | $30,308 |
| 2018 | $975 | $34,308 | $4,000 | $30,308 |
| 2017 | $975 | $34,308 | $4,000 | $30,308 |
| 2016 | $961 | $33,858 | $4,000 | $29,858 |
| 2015 | $880 | $31,112 | $4,000 | $27,112 |
| 2014 | $838 | $29,686 | $4,000 | $25,686 |
| 2013 | -- | $31,060 | $4,000 | $27,060 |
Source: Public Records
Map
Nearby Homes
- 806 New Franklin Rd
- 202 Park Hill Dr
- 114 Briarcliff Rd
- 204 Colonial St
- 110 Russell St
- 900 North St
- 134 S Page St
- 706 N Harlem Cir
- 109 Thomas St
- 210 Hearthstone Dr
- 219 Banks St
- 606 S Harlem Cir
- 608 S Harlem Cir
- 600 S Harlem Cir
- 616 S Harlem Cir
- 618 S Harlem Cir
- 121 Ct
- 131 Foch St
- 600,606,608,616 S Harlem
- 222 Beechwood Cir
- 170 Merrybrook Dr
- 172 Merrybrook Dr
- 204 Merrybrook Dr
- 168 Merrybrook Dr
- 229 Laurel Ln
- 301 Laurel Ln
- 208 Mimosa Terrace
- 225 Merrybrook Dr
- 155 Cascade Cir
- 208 Merrybrook Dr
- 162 Alton Dr
- 0 Mimosa Terrace Unit 8046804
- 209 Mimosa Terrace
- 153 Cascade Cir
- 303 Laurel Ln
- 160 Alton Dr
- 210 Merrybrook Dr
- 221 Merrybrook Dr
- 230 Laurel Ln
- 206 Mimosa Terrace