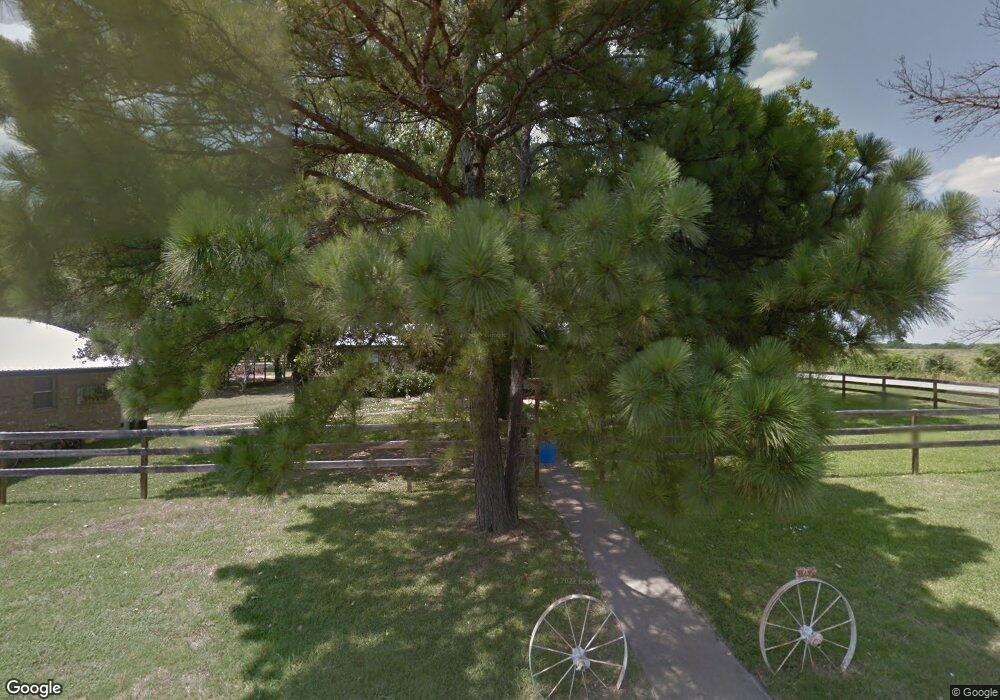
202 Mockingbird Ct Joshua, TX 76058
Estimated Value: $255,685 - $360,000
3
Beds
2
Baths
1,352
Sq Ft
$219/Sq Ft
Est. Value
About This Home
This home is located at 202 Mockingbird Ct, Joshua, TX 76058 and is currently estimated at $295,421, approximately $218 per square foot. 202 Mockingbird Ct is a home located in Johnson County with nearby schools including Plum Creek Elementary School, Joshua High School - 9th Grade Campus, and Joshua High School.
Ownership History
Date
Name
Owned For
Owner Type
Purchase Details
Closed on
Aug 8, 2008
Sold by
Deutsche Bank National Trust Co
Bought by
Bowling Gary W and Bowling Ashley P
Current Estimated Value
Home Financials for this Owner
Home Financials are based on the most recent Mortgage that was taken out on this home.
Original Mortgage
$94,387
Outstanding Balance
$62,222
Interest Rate
6.42%
Mortgage Type
Purchase Money Mortgage
Estimated Equity
$233,199
Purchase Details
Closed on
Apr 18, 2008
Sold by
Spake Jeffrey
Bought by
Deutsche Bank National Trust Co
Purchase Details
Closed on
Jul 14, 2006
Sold by
Stone Jamie C and Stone Stephen E
Bought by
Spake Jeffrey
Home Financials for this Owner
Home Financials are based on the most recent Mortgage that was taken out on this home.
Original Mortgage
$23,000
Interest Rate
6.62%
Mortgage Type
Stand Alone Second
Create a Home Valuation Report for This Property
The Home Valuation Report is an in-depth analysis detailing your home's value as well as a comparison with similar homes in the area
Home Values in the Area
Average Home Value in this Area
Purchase History
| Date | Buyer | Sale Price | Title Company |
|---|---|---|---|
| Bowling Gary W | -- | Rtt | |
| Deutsche Bank National Trust Co | $86,657 | None Available | |
| Spake Jeffrey | -- | Natc |
Source: Public Records
Mortgage History
| Date | Status | Borrower | Loan Amount |
|---|---|---|---|
| Open | Bowling Gary W | $94,387 | |
| Previous Owner | Spake Jeffrey | $23,000 | |
| Previous Owner | Spake Jeffrey | $92,000 |
Source: Public Records
Tax History Compared to Growth
Tax History
| Year | Tax Paid | Tax Assessment Tax Assessment Total Assessment is a certain percentage of the fair market value that is determined by local assessors to be the total taxable value of land and additions on the property. | Land | Improvement |
|---|---|---|---|---|
| 2025 | $3,695 | $241,587 | $35,000 | $206,587 |
| 2024 | $3,388 | $148,883 | $0 | $0 |
| 2023 | $1,655 | $167,067 | $35,000 | $132,067 |
| 2022 | $2,926 | $123,044 | $35,000 | $88,044 |
| 2021 | $2,770 | $113,044 | $25,000 | $88,044 |
| 2020 | $3,036 | $113,044 | $25,000 | $88,044 |
| 2019 | $3,136 | $110,217 | $25,000 | $85,217 |
| 2018 | $3,224 | $110,217 | $25,000 | $85,217 |
| 2017 | $2,930 | $100,217 | $15,000 | $85,217 |
| 2016 | $2,930 | $100,217 | $15,000 | $85,217 |
| 2015 | $2,405 | $100,217 | $15,000 | $85,217 |
| 2014 | $2,405 | $100,217 | $15,000 | $85,217 |
Source: Public Records
Map
Nearby Homes
- 4208 N Main St
- 3956 Redbird Ln
- 208 Ranch Rd
- 239 Ranch Rd
- 1520 S Broadway St
- 1440 S Broadway St
- 200 Indian Hills Rd
- 3601 Dove Creek Rd
- 324 County Road 904
- 3532 Dove Creek Rd
- 7004 Valley View Dr
- 7008 Valley View Dr
- 7016 Valley View Dr
- 6020 Glenwood Dr
- 4012 Twin Hills Ct
- 3012 Valley View Dr
- 4229 N Main St
- 1301 County Road 705
- 3004 Valley View Dr
- 4120 County Road 801
- 201 Mockingbird Ct
- 114 Canary Ln
- 204 Redbird Ct
- 202 Redbird Ct
- 206 Redbird Ct
- 4024 Redbird Ln
- 4118 Redbird Ln
- 201 Redbird Ct
- 205 Redbird Ct
- 4012 Redbird Ln
- 4009 Redbird Ln
- 4140 Redbird Ln
- 4132 Redbird Ln
- 4002 N Main St
- 109 Canary Ln
- 3956 N Main St
- 4128 N Main St
- 4210 Redbird Ln
- 4212 Redbird Ln
- 4000 Redbird Ln