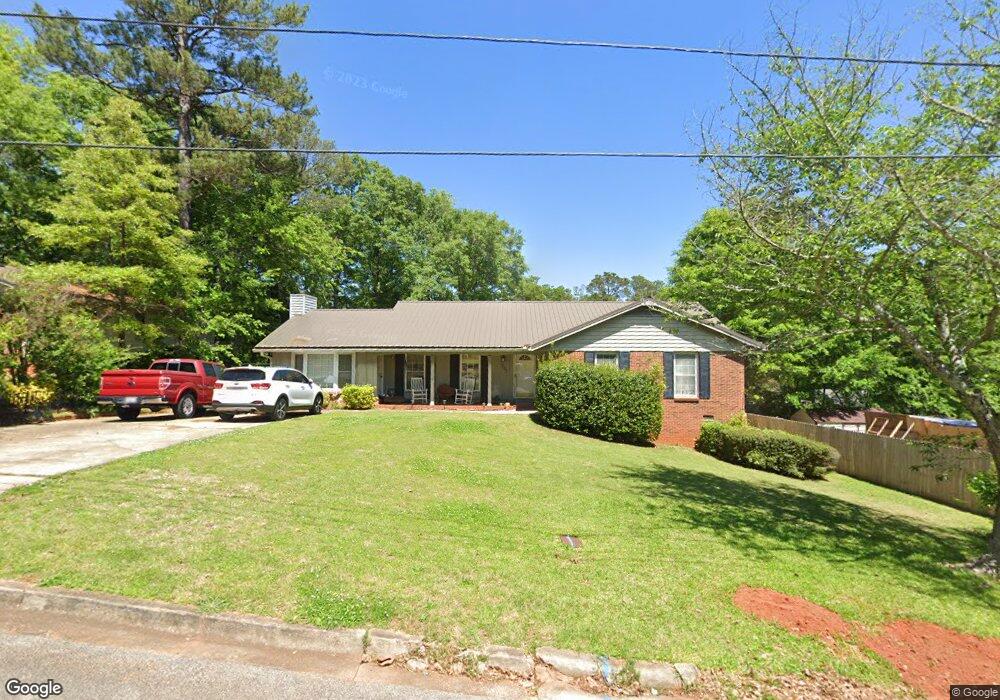
202 Monroe St Thomaston, GA 30286
Estimated Value: $166,000 - $214,000
3
Beds
2
Baths
2,738
Sq Ft
$70/Sq Ft
Est. Value
About This Home
This home is located at 202 Monroe St, Thomaston, GA 30286 and is currently estimated at $191,673, approximately $70 per square foot. 202 Monroe St is a home located in Upson County with nearby schools including Upson-Lee South Elementary School, Upson-Lee North Elementary School, and Upson-Lee Middle School.
Ownership History
Date
Name
Owned For
Owner Type
Purchase Details
Closed on
Feb 14, 2022
Sold by
Sosebee Anna
Bought by
Lewis Christopher and Lewis Monica
Current Estimated Value
Home Financials for this Owner
Home Financials are based on the most recent Mortgage that was taken out on this home.
Original Mortgage
$102,180
Interest Rate
3.55%
Mortgage Type
Cash
Purchase Details
Closed on
Nov 22, 2010
Sold by
Hsbc Bank Usa
Bought by
Sosebee Anna
Home Financials for this Owner
Home Financials are based on the most recent Mortgage that was taken out on this home.
Original Mortgage
$75,129
Interest Rate
4.3%
Mortgage Type
New Conventional
Purchase Details
Closed on
Mar 31, 2005
Sold by
Graham Nathan Andrew
Bought by
Reeves Kevin B
Home Financials for this Owner
Home Financials are based on the most recent Mortgage that was taken out on this home.
Original Mortgage
$93,000
Interest Rate
5.74%
Mortgage Type
New Conventional
Create a Home Valuation Report for This Property
The Home Valuation Report is an in-depth analysis detailing your home's value as well as a comparison with similar homes in the area
Home Values in the Area
Average Home Value in this Area
Purchase History
| Date | Buyer | Sale Price | Title Company |
|---|---|---|---|
| Lewis Christopher | $100,000 | -- | |
| Sosebee Anna | $72,500 | -- | |
| Reeves Kevin B | $118,000 | -- |
Source: Public Records
Mortgage History
| Date | Status | Borrower | Loan Amount |
|---|---|---|---|
| Closed | Lewis Christopher | $102,180 | |
| Previous Owner | Sosebee Anna | $75,129 | |
| Previous Owner | Reeves Kevin B | $93,000 | |
| Previous Owner | Reeves Kevin B | $25,000 |
Source: Public Records
Tax History Compared to Growth
Tax History
| Year | Tax Paid | Tax Assessment Tax Assessment Total Assessment is a certain percentage of the fair market value that is determined by local assessors to be the total taxable value of land and additions on the property. | Land | Improvement |
|---|---|---|---|---|
| 2024 | $2,070 | $68,869 | $6,093 | $62,776 |
| 2023 | $2,070 | $66,685 | $6,093 | $60,592 |
| 2022 | $1,574 | $56,570 | $6,093 | $50,477 |
| 2021 | $1,331 | $46,670 | $6,093 | $40,577 |
| 2020 | $1,362 | $44,716 | $6,093 | $38,623 |
| 2019 | $1,328 | $41,812 | $6,093 | $35,719 |
| 2018 | $1,329 | $41,812 | $6,093 | $35,719 |
| 2017 | $1,305 | $37,351 | $6,093 | $31,258 |
| 2016 | $1,293 | $36,374 | $6,093 | $30,281 |
| 2015 | $1,283 | $36,374 | $6,093 | $30,281 |
| 2014 | $1,286 | $36,374 | $6,093 | $30,281 |
Source: Public Records
Map
Nearby Homes
- 205 Herbert St
- 615 Peachtree Dr
- 312 Magnolia Ave
- 117 Triune Mill Rd
- 300 Mallory St
- 203 Walter St
- 133 Springdale Dr
- 326 Parkway Dr
- 500 E Main St
- 306 E Gordon St
- 205 N Hightower St
- 400 S Center St
- 720 S Church St
- 304 Cotton Ave
- 328 S Green St
- 221 Avenue L
- 0 Highway 19 S Unit 24061935
- 417 Howell St
- 209 Upson Ave
- LOTS 9-21 Triune Mill Rd
- 204 Monroe St
- 207 Jefferson St
- 201 Jefferson St
- 203 Jefferson St
- 209 Jefferson St
- 0 Monroe St Unit 8476065
- 0 Monroe St Unit 8297291
- 0 Monroe St
- 211 Jefferson St
- 0 Jefferson St Unit 7506262
- 0 Jefferson St Unit 8656625
- 0 Jefferson St Unit 8272914
- 0 Jefferson St Unit 8210183
- 0 Jefferson St Unit 8137777
- 0 Jefferson St Unit 8849066
- 0 Jefferson St Unit 3246160
- 0 Jefferson St Unit 7079662
- 203 Monroe St
- 105 Jefferson St
- 213 Jefferson St