Estimated Value: $939,000 - $1,243,000
2
Beds
4
Baths
4,287
Sq Ft
$265/Sq Ft
Est. Value
About This Home
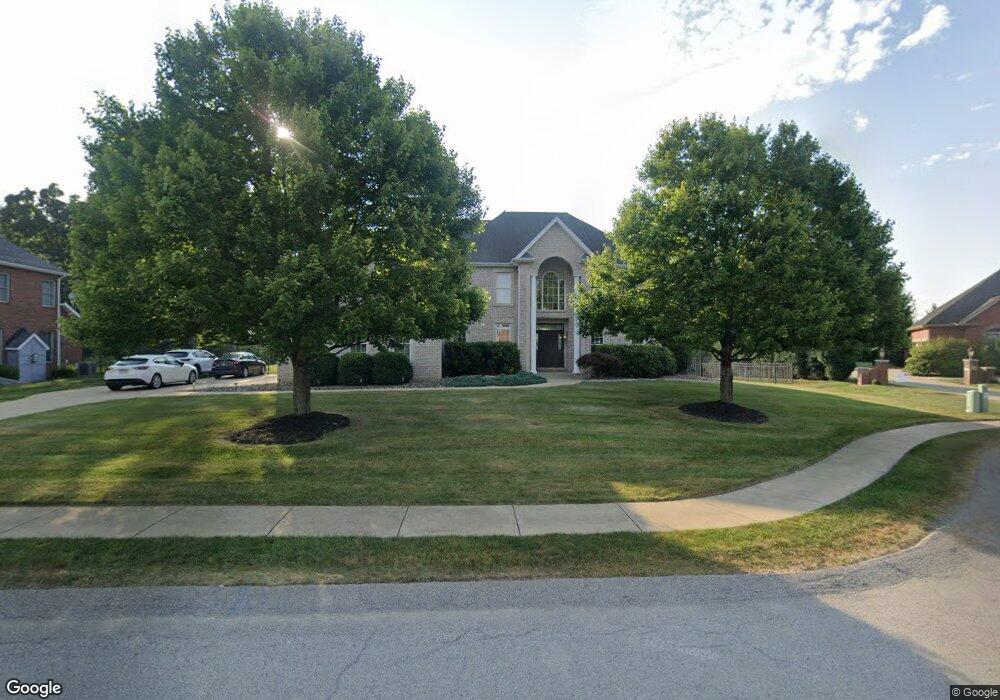
This home is located at 202 Morgan Ct, Mars, PA 16046 and is currently estimated at $1,135,653, approximately $264 per square foot. 202 Morgan Ct is a home located in Butler County with nearby schools including Mars Area Primary Center, Mars Area Elementary School, and Mars Area Centennial School.
Ownership History
Date
Name
Owned For
Owner Type
Purchase Details
Closed on
Apr 7, 2006
Sold by
Katekovich Raymond
Bought by
Vactor Michael S
Current Estimated Value
Home Financials for this Owner
Home Financials are based on the most recent Mortgage that was taken out on this home.
Original Mortgage
$496,000
Interest Rate
6.53%
Mortgage Type
New Conventional
Purchase Details
Closed on
Sep 22, 2005
Sold by
Wild Contracting Custom H
Bought by
Katekovich Raymond
Home Financials for this Owner
Home Financials are based on the most recent Mortgage that was taken out on this home.
Original Mortgage
$456,000
Interest Rate
5.93%
Mortgage Type
New Conventional
Create a Home Valuation Report for This Property
The Home Valuation Report is an in-depth analysis detailing your home's value as well as a comparison with similar homes in the area
Home Values in the Area
Average Home Value in this Area
Purchase History
| Date | Buyer | Sale Price | Title Company |
|---|---|---|---|
| Vactor Michael S | $620,000 | -- | |
| Katekovich Raymond | $598,000 | -- |
Source: Public Records
Mortgage History
| Date | Status | Borrower | Loan Amount |
|---|---|---|---|
| Previous Owner | Vactor Michael S | $496,000 | |
| Previous Owner | Katekovich Raymond | $456,000 |
Source: Public Records
Tax History
| Year | Tax Paid | Tax Assessment Tax Assessment Total Assessment is a certain percentage of the fair market value that is determined by local assessors to be the total taxable value of land and additions on the property. | Land | Improvement |
|---|---|---|---|---|
| 2025 | $7,140 | $50,860 | $5,490 | $45,370 |
| 2024 | $6,963 | $50,860 | $5,490 | $45,370 |
| 2023 | $6,752 | $50,860 | $5,490 | $45,370 |
| 2022 | $6,752 | $50,860 | $5,490 | $45,370 |
| 2021 | $6,752 | $50,860 | $0 | $0 |
| 2020 | $6,752 | $50,860 | $5,490 | $45,370 |
| 2019 | $6,752 | $50,860 | $5,490 | $45,370 |
| 2018 | $6,631 | $50,860 | $5,490 | $45,370 |
| 2017 | $6,631 | $50,860 | $5,490 | $45,370 |
| 2016 | $1,755 | $50,860 | $5,490 | $45,370 |
| 2015 | $1,031 | $50,860 | $5,490 | $45,370 |
| 2014 | $1,031 | $50,860 | $5,490 | $45,370 |
Source: Public Records
Map
Nearby Homes
Your Personal Tour Guide
Ask me questions while you tour the home.