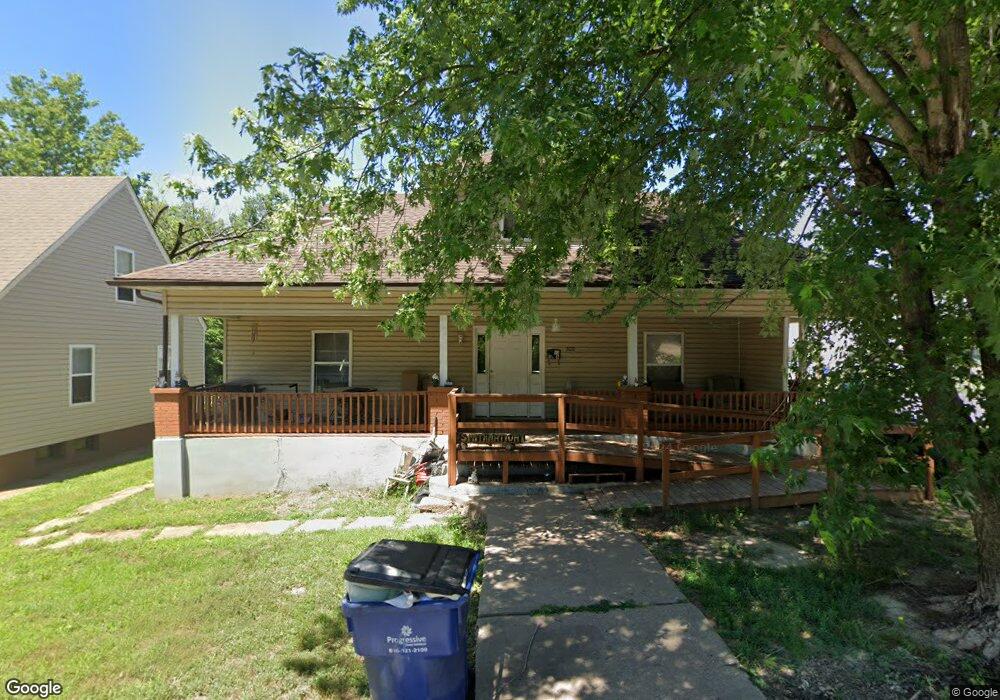
202 N 3rd St Festus, MO 63028
Festus/Crystal City NeighborhoodEstimated Value: $163,437 - $215,000
Studio
--
Bath
1,328
Sq Ft
$140/Sq Ft
Est. Value
About This Home
This home is located at 202 N 3rd St, Festus, MO 63028 and is currently estimated at $185,359, approximately $139 per square foot. 202 N 3rd St is a home located in Jefferson County with nearby schools including Festus Elementary School, Festus Intermediate School, and Festus Middle School.
Ownership History
Date
Name
Owned For
Owner Type
Purchase Details
Closed on
Apr 5, 2021
Sold by
Csm Property Management One Llc
Bought by
Csm Property Management One Llc
Current Estimated Value
Purchase Details
Closed on
May 1, 2007
Sold by
Kent Charles R and Kent Janet K
Bought by
Stockton John and Stockton Shannon
Home Financials for this Owner
Home Financials are based on the most recent Mortgage that was taken out on this home.
Original Mortgage
$40,000
Interest Rate
6.13%
Mortgage Type
Purchase Money Mortgage
Purchase Details
Closed on
Jan 13, 2003
Sold by
Home Service Oil Co
Bought by
Kent Charles R and Kent Janet K
Home Financials for this Owner
Home Financials are based on the most recent Mortgage that was taken out on this home.
Original Mortgage
$60,000
Interest Rate
6.16%
Purchase Details
Closed on
Nov 10, 1999
Sold by
Scherrer Nelson and Scherrer Engla
Bought by
Home Service Oil Company
Create a Home Valuation Report for This Property
The Home Valuation Report is an in-depth analysis detailing your home's value as well as a comparison with similar homes in the area
Home Values in the Area
Average Home Value in this Area
Purchase History
| Date | Buyer | Sale Price | Title Company |
|---|---|---|---|
| Csm Property Management One Llc | -- | None Available | |
| Stockton John | -- | Ust | |
| Kent Charles R | -- | -- | |
| Home Service Oil Company | -- | -- |
Source: Public Records
Mortgage History
| Date | Status | Borrower | Loan Amount |
|---|---|---|---|
| Closed | Stockton John | $40,000 | |
| Previous Owner | Kent Charles R | $60,000 |
Source: Public Records
Tax History
| Year | Tax Paid | Tax Assessment Tax Assessment Total Assessment is a certain percentage of the fair market value that is determined by local assessors to be the total taxable value of land and additions on the property. | Land | Improvement |
|---|---|---|---|---|
| 2025 | $583 | $10,900 | $1,500 | $9,400 |
| 2024 | $583 | $10,300 | $1,500 | $8,800 |
| 2023 | $583 | $10,300 | $1,500 | $8,800 |
| 2022 | $580 | $10,300 | $1,500 | $8,800 |
| 2021 | $581 | $10,300 | $1,500 | $8,800 |
| 2020 | $559 | $9,300 | $1,200 | $8,100 |
| 2019 | $559 | $9,300 | $1,200 | $8,100 |
| 2018 | $504 | $9,300 | $1,200 | $8,100 |
| 2017 | $504 | $9,300 | $1,200 | $8,100 |
| 2016 | $392 | $7,200 | $700 | $6,500 |
| 2015 | $390 | $7,200 | $700 | $6,500 |
| 2013 | -- | $6,300 | $700 | $5,600 |
Source: Public Records
Map
Nearby Homes
Your Personal Tour Guide
Ask me questions while you tour the home.