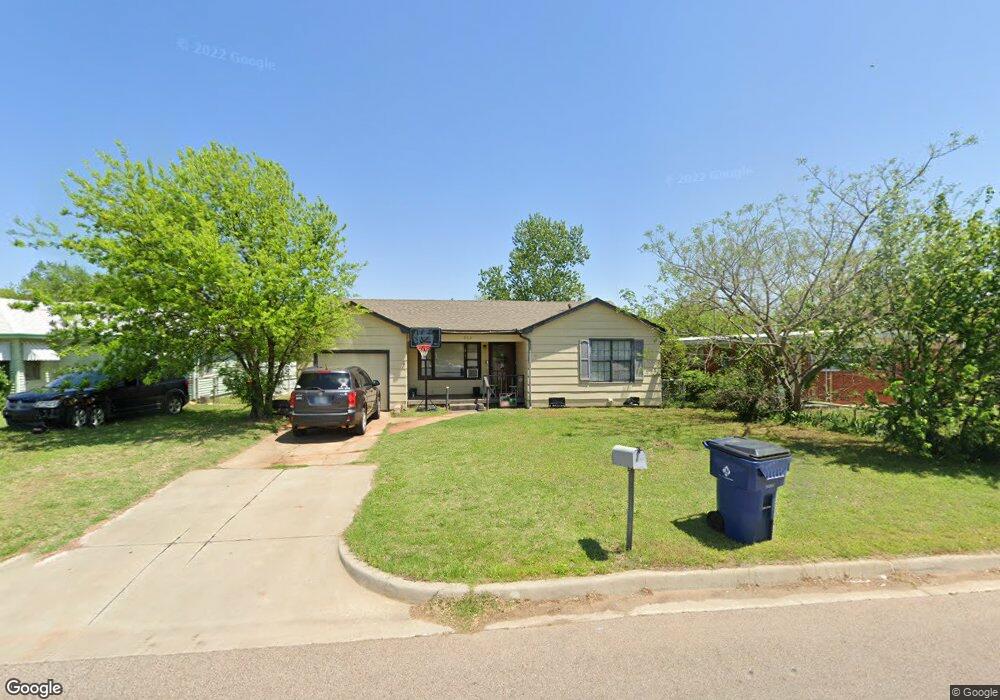
202 N D St Duncan, OK 73533
Estimated Value: $52,000 - $89,000
3
Beds
1
Bath
986
Sq Ft
$65/Sq Ft
Est. Value
About This Home
This home is located at 202 N D St, Duncan, OK 73533 and is currently estimated at $63,925, approximately $64 per square foot. 202 N D St is a home located in Stephens County with nearby schools including Woodrow Wilson Elementary School, Duncan Middle School, and Duncan High School.
Ownership History
Date
Name
Owned For
Owner Type
Purchase Details
Closed on
Sep 23, 2010
Sold by
Warsop Alma G
Bought by
M & S Rentals Llc
Current Estimated Value
Home Financials for this Owner
Home Financials are based on the most recent Mortgage that was taken out on this home.
Original Mortgage
$26,757
Interest Rate
4.39%
Mortgage Type
Purchase Money Mortgage
Purchase Details
Closed on
Jun 7, 2004
Sold by
Underwood Edith V
Create a Home Valuation Report for This Property
The Home Valuation Report is an in-depth analysis detailing your home's value as well as a comparison with similar homes in the area
Home Values in the Area
Average Home Value in this Area
Purchase History
| Date | Buyer | Sale Price | Title Company |
|---|---|---|---|
| M & S Rentals Llc | $25,000 | None Available | |
| -- | $23,000 | -- |
Source: Public Records
Mortgage History
| Date | Status | Borrower | Loan Amount |
|---|---|---|---|
| Closed | M & S Rentals Llc | $26,757 |
Source: Public Records
Tax History Compared to Growth
Tax History
| Year | Tax Paid | Tax Assessment Tax Assessment Total Assessment is a certain percentage of the fair market value that is determined by local assessors to be the total taxable value of land and additions on the property. | Land | Improvement |
|---|---|---|---|---|
| 2025 | $280 | $3,195 | $285 | $2,910 |
| 2024 | $280 | $3,292 | $285 | $3,007 |
| 2023 | $280 | $3,289 | $285 | $3,004 |
| 2022 | $254 | $2,986 | $285 | $2,701 |
| 2021 | $290 | $3,407 | $285 | $3,122 |
| 2020 | $267 | $3,091 | $285 | $2,806 |
| 2019 | $259 | $2,997 | $285 | $2,712 |
| 2018 | $276 | $3,117 | $285 | $2,832 |
| 2017 | $253 | $3,095 | $283 | $2,812 |
| 2016 | $239 | $2,807 | $277 | $2,530 |
| 2015 | $238 | $2,673 | $276 | $2,397 |
| 2014 | $238 | $2,546 | $275 | $2,271 |
Source: Public Records
Map
Nearby Homes