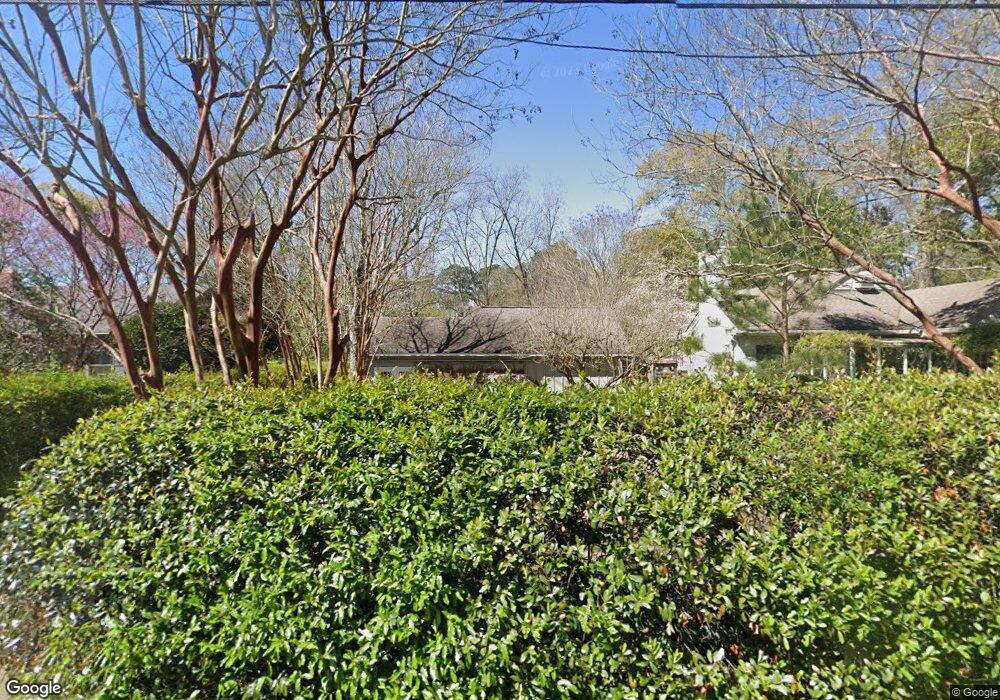
202 N Lee St Lagrange, GA 30240
Estimated Value: $251,000 - $320,396
3
Beds
2
Baths
2,623
Sq Ft
$112/Sq Ft
Est. Value
About This Home
This home is located at 202 N Lee St, Lagrange, GA 30240 and is currently estimated at $294,099, approximately $112 per square foot. 202 N Lee St is a home located in Troup County with nearby schools including Ethel W. Kight Elementary School, Hollis Hand Elementary School, and Franklin Forest Elementary School.
Ownership History
Date
Name
Owned For
Owner Type
Purchase Details
Closed on
Dec 31, 2008
Sold by
Lawrence Lafon P Of
Bought by
Lawrence John D
Current Estimated Value
Home Financials for this Owner
Home Financials are based on the most recent Mortgage that was taken out on this home.
Original Mortgage
$130,000
Outstanding Balance
$85,010
Interest Rate
5.48%
Mortgage Type
New Conventional
Estimated Equity
$209,090
Purchase Details
Closed on
Jan 24, 2001
Sold by
City Of Lagrange
Bought by
John D Lawrence
Purchase Details
Closed on
Jun 18, 1974
Sold by
Ruth B West
Bought by
City Of Lagrange
Purchase Details
Closed on
Jan 1, 1974
Sold by
John T West
Bought by
Ruth B West
Purchase Details
Closed on
Jan 1, 1971
Sold by
Wilbur J Whatley
Bought by
John T West
Purchase Details
Closed on
Jan 1, 1967
Sold by
Ida Lou Winn
Bought by
Wilbur J Whatley
Create a Home Valuation Report for This Property
The Home Valuation Report is an in-depth analysis detailing your home's value as well as a comparison with similar homes in the area
Purchase History
We collect this data history from publicly available records. To have your information removed, we recommend requesting removal directly through your county’s website.
| Date | Buyer | Sale Price | Title Company |
|---|---|---|---|
| Lawrence John D | -- | -- | |
| John D Lawrence | -- | -- | |
| City Of Lagrange | $35,000 | -- | |
| Ruth B West | -- | -- | |
| John T West | $11,500 | -- | |
| Wilbur J Whatley | -- | -- |
Source: Public Records
Mortgage History
We collect this data history from publicly available records. To have your information removed, we recommend requesting removal directly through your county’s website.
| Date | Status | Borrower | Loan Amount |
|---|---|---|---|
| Open | Lawrence John D | $130,000 |
Source: Public Records
Tax History
| Year | Tax Paid | Tax Assessment Tax Assessment Total Assessment is a certain percentage of the fair market value that is determined by local assessors to be the total taxable value of land and additions on the property. | Land | Improvement |
|---|---|---|---|---|
| 2025 | $2,970 | $113,472 | $10,000 | $103,472 |
| 2024 | $2,842 | $106,192 | $11,800 | $94,392 |
| 2023 | $2,764 | $103,352 | $11,800 | $91,552 |
| 2022 | $2,750 | $100,512 | $11,800 | $88,712 |
| 2021 | $2,741 | $92,868 | $11,800 | $81,068 |
| 2020 | $2,741 | $92,868 | $11,800 | $81,068 |
| 2019 | $2,712 | $91,900 | $11,800 | $80,100 |
| 2018 | $2,703 | $91,600 | $11,500 | $80,100 |
| 2017 | $2,703 | $91,600 | $11,500 | $80,100 |
| 2016 | $2,706 | $91,695 | $11,500 | $80,195 |
| 2015 | $2,720 | $92,026 | $11,831 | $80,195 |
| 2014 | $2,597 | $87,805 | $11,831 | $75,974 |
| 2013 | -- | $89,116 | $11,844 | $77,272 |
Source: Public Records
Map
Nearby Homes
- 0 N Lee St Unit 10550825
- 310 N Lee St
- 217 Jefferson St
- 412 S Lee St
- 211 Moores Hill
- 0 Moores Hill
- 138 Martha St
- 517 Jefferson St
- 519 Freeman St
- 202 Parker Ln
- 613 S Lee St
- 304 Boulevard
- 208 Boulevard
- 109 Garfield St
- 600 Park Ave
- 601 Cherokee Rd
- 207 Wilkes St
- 0 Hills and Dales Farm Rd
- 408 Harwell Ave
- 802 Monroe St
Your Personal Tour Guide
Ask me questions while you tour the home.