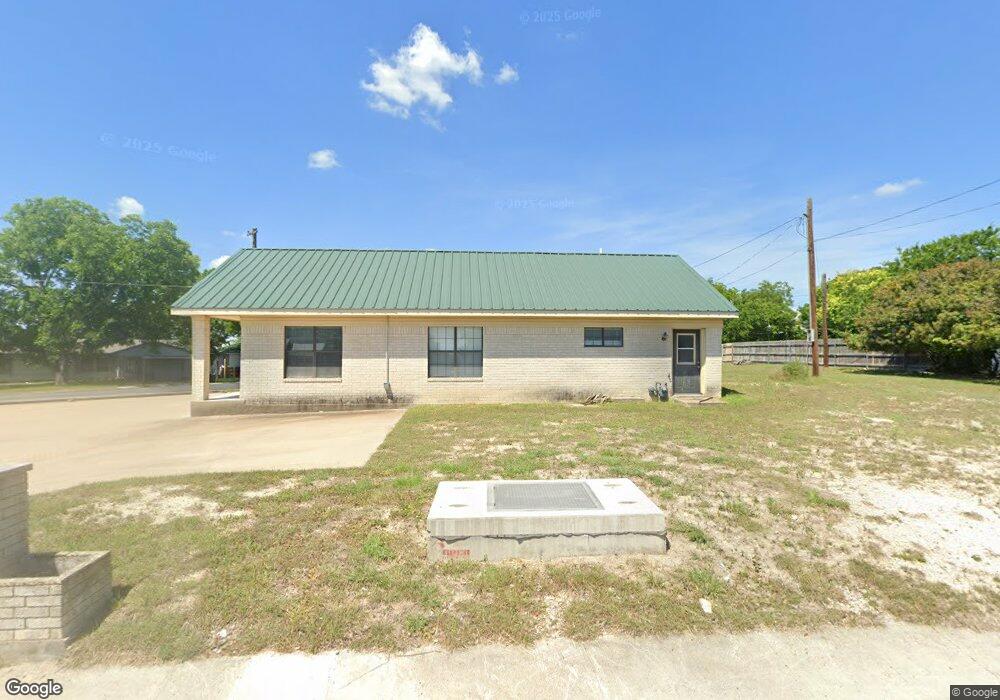
202 N Porter St Lampasas, TX 76550
Estimated Value: $207,000 - $380,000
--
Bed
--
Bath
2,824
Sq Ft
$96/Sq Ft
Est. Value
About This Home
This home is located at 202 N Porter St, Lampasas, TX 76550 and is currently estimated at $271,080, approximately $95 per square foot. 202 N Porter St is a home located in Lampasas County with nearby schools including Kline Whitis Elementary School, Lampasas Middle School, and Lampasas High School.
Ownership History
Date
Name
Owned For
Owner Type
Purchase Details
Closed on
Jul 21, 2022
Sold by
Hunt Denise M
Bought by
Jalapeno Properties Llc
Current Estimated Value
Home Financials for this Owner
Home Financials are based on the most recent Mortgage that was taken out on this home.
Original Mortgage
$144,000
Outstanding Balance
$137,164
Interest Rate
5.23%
Mortgage Type
New Conventional
Estimated Equity
$133,916
Purchase Details
Closed on
Dec 20, 2010
Sold by
Massey Deborah G
Bought by
Matthews David L and Matthews Laural L
Home Financials for this Owner
Home Financials are based on the most recent Mortgage that was taken out on this home.
Original Mortgage
$30,000
Interest Rate
4.24%
Create a Home Valuation Report for This Property
The Home Valuation Report is an in-depth analysis detailing your home's value as well as a comparison with similar homes in the area
Home Values in the Area
Average Home Value in this Area
Purchase History
| Date | Buyer | Sale Price | Title Company |
|---|---|---|---|
| Jalapeno Properties Llc | -- | None Listed On Document | |
| Matthews David L | $30,000 | Lampasas County Abstract Co |
Source: Public Records
Mortgage History
| Date | Status | Borrower | Loan Amount |
|---|---|---|---|
| Open | Jalapeno Properties Llc | $144,000 | |
| Previous Owner | Matthews David L | $30,000 |
Source: Public Records
Tax History Compared to Growth
Tax History
| Year | Tax Paid | Tax Assessment Tax Assessment Total Assessment is a certain percentage of the fair market value that is determined by local assessors to be the total taxable value of land and additions on the property. | Land | Improvement |
|---|---|---|---|---|
| 2024 | $3,658 | $192,000 | $18,550 | $173,450 |
| 2023 | $2,953 | $160,340 | $15,900 | $144,440 |
| 2022 | $2,040 | $141,600 | $15,900 | $125,700 |
| 2021 | $2,140 | $100,430 | $14,570 | $85,860 |
| 2020 | $1,956 | $80,300 | $13,250 | $67,050 |
| 2019 | $1,977 | $78,380 | $13,250 | $65,130 |
| 2018 | $1,834 | $72,700 | $10,350 | $62,350 |
| 2017 | $1,813 | $72,700 | $10,350 | $62,350 |
| 2016 | $1,776 | $71,210 | $10,350 | $60,860 |
| 2015 | -- | $71,210 | $10,350 | $60,860 |
| 2014 | -- | $63,740 | $10,350 | $53,390 |
Source: Public Records
Map
Nearby Homes