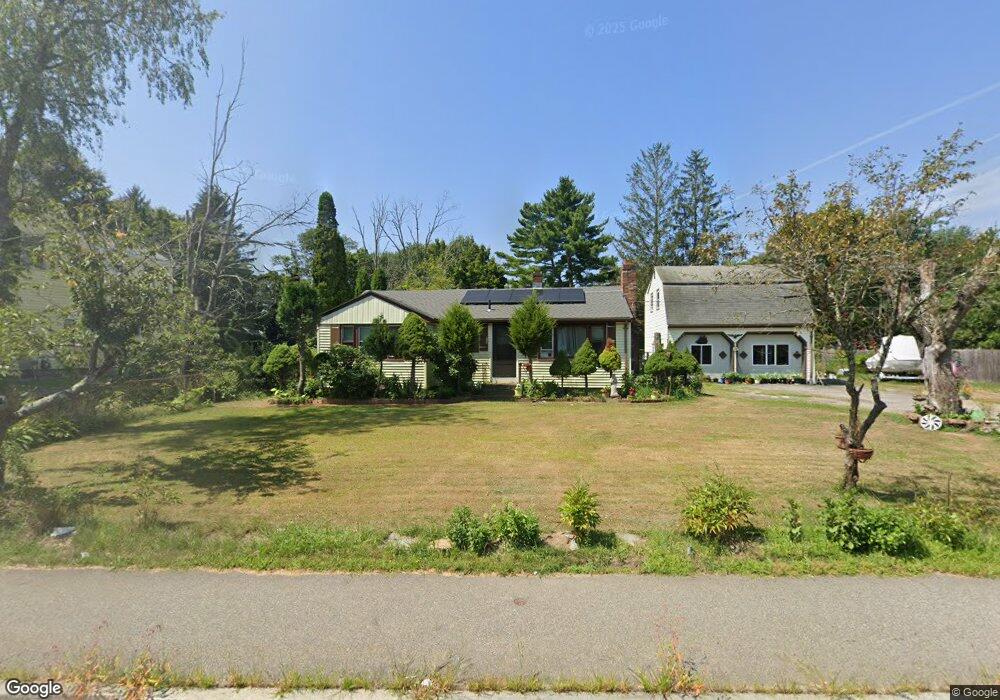
202 N Quincy St Brockton, MA 02302
Montello NeighborhoodEstimated Value: $402,000 - $485,487
3
Beds
1
Bath
968
Sq Ft
$467/Sq Ft
Est. Value
About This Home
This home is located at 202 N Quincy St, Brockton, MA 02302 and is currently estimated at $451,872, approximately $466 per square foot. 202 N Quincy St is a home located in Plymouth County with nearby schools including Brookfield Elementary School, Mary E. Baker Elementary School, and Downey Elementary School.
Ownership History
Date
Name
Owned For
Owner Type
Purchase Details
Closed on
Sep 14, 2001
Sold by
Vanlam Tam Van
Bought by
Lam Phuong
Current Estimated Value
Home Financials for this Owner
Home Financials are based on the most recent Mortgage that was taken out on this home.
Original Mortgage
$110,000
Outstanding Balance
$42,894
Interest Rate
6.99%
Mortgage Type
Purchase Money Mortgage
Estimated Equity
$408,978
Purchase Details
Closed on
Dec 8, 1995
Sold by
Crescent Cu
Bought by
Vanlam Tam Van
Home Financials for this Owner
Home Financials are based on the most recent Mortgage that was taken out on this home.
Original Mortgage
$66,400
Interest Rate
7.44%
Mortgage Type
Purchase Money Mortgage
Purchase Details
Closed on
May 17, 1995
Sold by
Phamdam Dam Van and Lam Phuong T
Bought by
Crescent Cu
Purchase Details
Closed on
Dec 14, 1989
Sold by
Inkel Peter J
Bought by
Vanpham Dan Van
Home Financials for this Owner
Home Financials are based on the most recent Mortgage that was taken out on this home.
Original Mortgage
$99,200
Interest Rate
9.73%
Mortgage Type
Purchase Money Mortgage
Create a Home Valuation Report for This Property
The Home Valuation Report is an in-depth analysis detailing your home's value as well as a comparison with similar homes in the area
Home Values in the Area
Average Home Value in this Area
Purchase History
| Date | Buyer | Sale Price | Title Company |
|---|---|---|---|
| Lam Phuong | $140,000 | -- | |
| Vanlam Tam Van | $83,000 | -- | |
| Crescent Cu | $102,300 | -- | |
| Vanpham Dan Van | $124,000 | -- |
Source: Public Records
Mortgage History
| Date | Status | Borrower | Loan Amount |
|---|---|---|---|
| Open | Vanpham Dan Van | $60,000 | |
| Open | Vanpham Dan Van | $110,000 | |
| Previous Owner | Vanpham Dan Van | $66,400 | |
| Previous Owner | Vanpham Dan Van | $99,200 |
Source: Public Records
Tax History Compared to Growth
Tax History
| Year | Tax Paid | Tax Assessment Tax Assessment Total Assessment is a certain percentage of the fair market value that is determined by local assessors to be the total taxable value of land and additions on the property. | Land | Improvement |
|---|---|---|---|---|
| 2025 | $5,089 | $420,200 | $193,100 | $227,100 |
| 2024 | $5,036 | $419,000 | $193,100 | $225,900 |
| 2023 | $5,082 | $391,500 | $161,300 | $230,200 |
| 2022 | $4,669 | $334,200 | $148,100 | $186,100 |
| 2021 | $4,351 | $300,100 | $125,500 | $174,600 |
| 2020 | $4,260 | $281,200 | $120,200 | $161,000 |
| 2019 | $4,000 | $257,400 | $110,200 | $147,200 |
| 2018 | $3,779 | $235,300 | $110,200 | $125,100 |
| 2017 | $3,676 | $228,300 | $110,200 | $118,100 |
| 2016 | $3,623 | $208,700 | $107,800 | $100,900 |
| 2015 | $3,445 | $189,800 | $107,800 | $82,000 |
| 2014 | $3,546 | $195,600 | $107,800 | $87,800 |
Source: Public Records
Map
Nearby Homes
- 196 N Quincy St
- 203 N Quincy St
- 199 N Quincy St
- 191 N Quincy St
- 191 N Quincy St
- 216 N Quincy St
- 188 N Quincy St
- 213 N Quincy St
- 185 N Quincy St
- 208 N Quincy St
- 221 N Quincy St
- 222 N Quincy St
- 182 N Quincy St
- 13 Rosemary St
- 179 N Quincy St Unit D
- 179 N Quincy St
- 179 N Quincy St Unit 2
- 19 Rosemary St
- 227 N Quincy St
- 175 N Quincy St