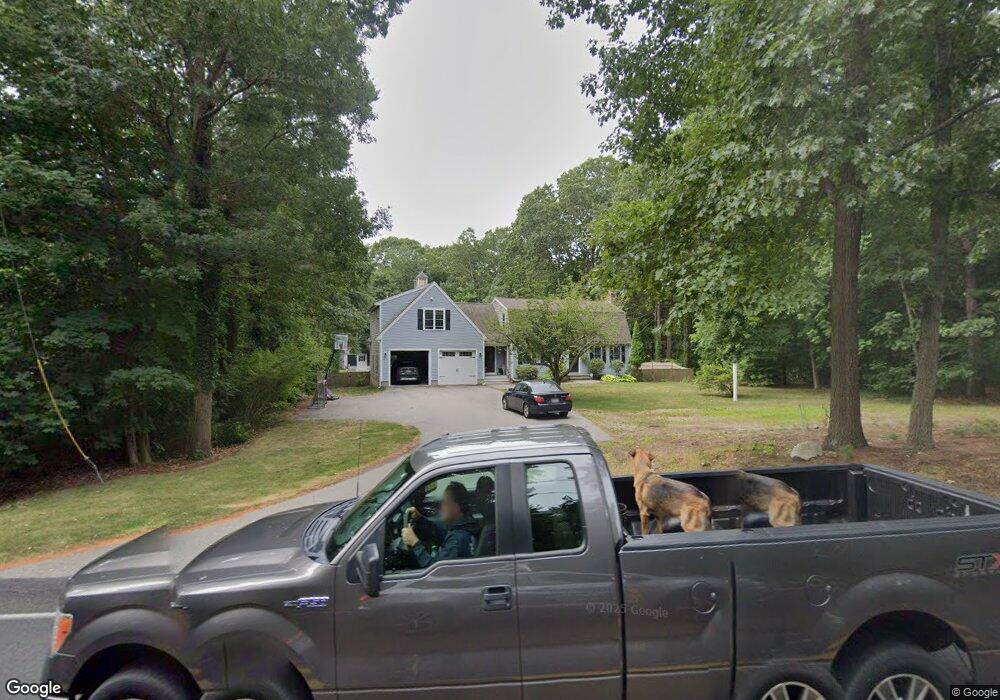
202 Oldham St Pembroke, MA 02359
Estimated Value: $620,000 - $777,000
3
Beds
3
Baths
2,146
Sq Ft
$320/Sq Ft
Est. Value
About This Home
This home is located at 202 Oldham St, Pembroke, MA 02359 and is currently estimated at $687,342, approximately $320 per square foot. 202 Oldham St is a home located in Plymouth County with nearby schools including Pembroke High School and Cardinal Cushing Centers.
Ownership History
Date
Name
Owned For
Owner Type
Purchase Details
Closed on
Feb 20, 2001
Sold by
Grignon Andrew J and Grignon John J
Bought by
Dorsey Sean M and Dorsey Kristin Barrett
Current Estimated Value
Purchase Details
Closed on
Nov 2, 1993
Sold by
John J Grignon Ret and Grignon John J
Bought by
Grignon Andrew J and Grignon John J
Create a Home Valuation Report for This Property
The Home Valuation Report is an in-depth analysis detailing your home's value as well as a comparison with similar homes in the area
Home Values in the Area
Average Home Value in this Area
Purchase History
| Date | Buyer | Sale Price | Title Company |
|---|---|---|---|
| Dorsey Sean M | $225,000 | -- | |
| Grignon Andrew J | $142,500 | -- |
Source: Public Records
Mortgage History
| Date | Status | Borrower | Loan Amount |
|---|---|---|---|
| Open | Grignon Andrew J | $50,000 | |
| Open | Grignon Andrew J | $249,500 | |
| Closed | Grignon Andrew J | $39,000 |
Source: Public Records
Tax History Compared to Growth
Tax History
| Year | Tax Paid | Tax Assessment Tax Assessment Total Assessment is a certain percentage of the fair market value that is determined by local assessors to be the total taxable value of land and additions on the property. | Land | Improvement |
|---|---|---|---|---|
| 2025 | $7,115 | $591,900 | $305,300 | $286,600 |
| 2024 | $6,773 | $563,000 | $300,100 | $262,900 |
| 2023 | $6,686 | $525,600 | $275,300 | $250,300 |
| 2022 | $6,418 | $453,600 | $230,100 | $223,500 |
| 2021 | $6,354 | $435,800 | $220,100 | $215,700 |
| 2020 | $6,003 | $414,300 | $215,300 | $199,000 |
| 2019 | $5,858 | $401,200 | $205,300 | $195,900 |
| 2018 | $5,752 | $386,300 | $200,100 | $186,200 |
| 2017 | $5,702 | $377,600 | $190,100 | $187,500 |
| 2016 | $5,607 | $367,400 | $177,700 | $189,700 |
| 2015 | $5,326 | $361,300 | $170,100 | $191,200 |
Source: Public Records
Map
Nearby Homes
- 21 Beechwood Ave
- 89 W Elm St
- 140 Wampatuck St
- 6 Ruth Rd
- 127 Mattakeesett St
- 180 Wampatuck St
- 23 Pondview Ave
- 53 Grove St
- 110 Queens Brook Rd
- 42 Taylor Point Rd
- 166 Pine Grove Ave
- 269 Lakeside Rd
- 69 Dwelley St
- 18 Allen St
- 20 Acorn Ln
- 438 Maquan St
- 456 Gorwin Dr
- 109 Richard Rd
- 52 Richard Rd
- 145 Gorwin Dr
- 14 Wampatuck St
- 196 Oldham St
- 225 Oldham St
- 195 Oldham St
- 13 Wampatuck St
- 18 Wampatuck St
- 190 Oldham St
- 24 Wampatuck St
- 23 Wampatuck St
- 20 Wampatuck St
- 234 Oldham St
- 239 Oldham St
- 184 Oldham St
- 28 Wampatuck St
- 185 Oldham St
- 240 Oldham St
- 180 Oldham St
- 16 Oakdale Terrace
- 34 Wampatuck St
- 12 Oakdale Terrace