202 Olive St Cleburne, TX 76031
Estimated Value: $204,000 - $244,000
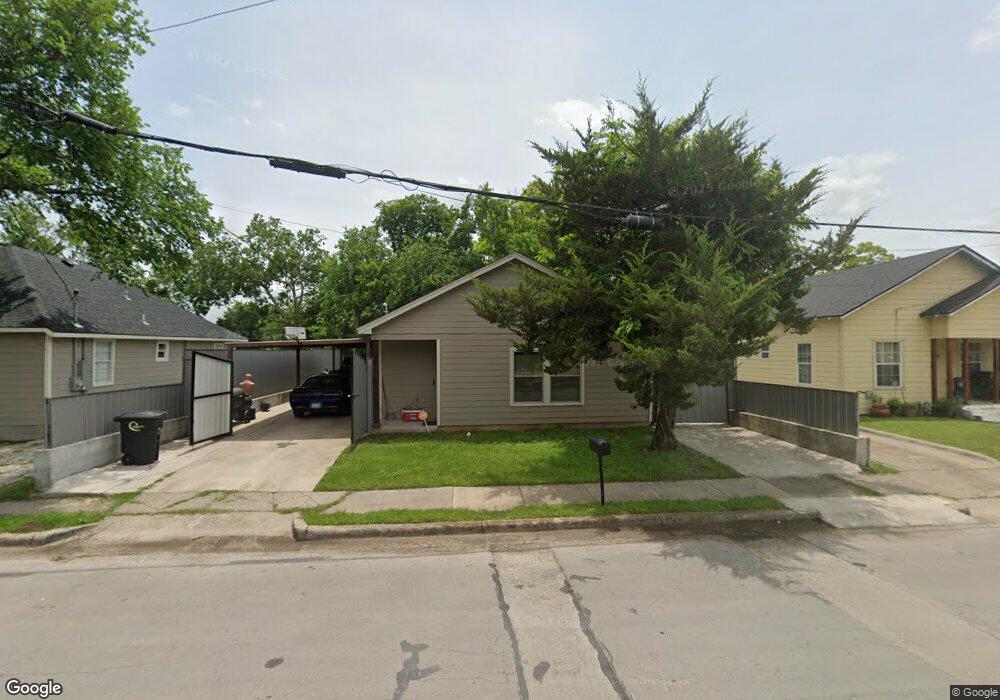
About This Home
This home is located at 202 Olive St, Cleburne, TX 76031 and is currently estimated at $228,720, approximately $207 per square foot. 202 Olive St is a home located in Johnson County with nearby schools including Santa Fe Elementary School, Lowell Smith Jr. Middle School, and Cleburne High School.
Ownership History
We collect this data history from publicly available records. To have your information removed, we recommend requesting removal directly through your county’s website.
Purchase Details
Home Financials for this Owner
Home Financials are based on the most recent Mortgage that was taken out on this home.Purchase Details
Purchase Details
Home Values in the Area
Average Home Value in this Area
Purchase History
We collect this data history from publicly available records. To have your information removed, we recommend requesting removal directly through your county’s website.
| Date | Buyer | Sale Price | Title Company |
|---|---|---|---|
| -- | Fwt | ||
| -- | Tiago Title Llc | ||
| $6,500 | None Available |
Mortgage History
We collect this data history from publicly available records. To have your information removed, we recommend requesting removal directly through your county’s website.
| Date | Status | Borrower | Loan Amount |
|---|---|---|---|
| Open | $139,900 |
Tax History
We collect this data history from publicly available records. To have your information removed, we recommend requesting removal directly through your county’s website.
| Year | Tax Paid | Tax Assessment Tax Assessment Total Assessment is a certain percentage of the fair market value that is determined by local assessors to be the total taxable value of land and additions on the property. | Land | Improvement |
|---|---|---|---|---|
| 2025 | $2,394 | $250,027 | $43,000 | $207,027 |
| 2024 | $4,017 | $180,169 | $0 | $0 |
| 2023 | $2,048 | $170,185 | $23,500 | $146,685 |
| 2022 | $3,726 | $148,900 | $23,500 | $125,400 |
| 2021 | $3,885 | $148,900 | $23,500 | $125,400 |
| 2020 | $4,029 | $145,400 | $20,000 | $125,400 |
| 2019 | $295 | $10,000 | $10,000 | $0 |
| 2018 | $222 | $7,500 | $7,500 | $0 |
| 2017 | $221 | $7,500 | $7,500 | $0 |
| 2016 | $221 | $7,500 | $7,500 | $0 |
| 2015 | $200 | $7,500 | $7,500 | $0 |
| 2014 | $200 | $7,500 | $7,500 | $0 |
Map
- 603 E Willingham St
- 601 E Willingham St
- 731 E Brown St
- 402 Robbins St
- 306 Royal St
- 703 Olive St
- 821 E Brown St
- 407 E Willingham St
- 406 E Willingham St
- 201 Grandview St
- 938 E Henderson St
- 602 Trinity St
- 103 Atlantic St
- 109 N Kouns St
- 416 N Anglin St
- 215 Heath St
- 1101 N Border St
- 611 N Anglin St
- 719 N Border St
- 8256 Farm To Market 4
- 204 Olive St
- 200 Olive St
- 206 Olive St
- 605 E Willingham St
- 208 Olive St
- 201 Olive St
- 607 E Willingham St
- 511 E Willingham St
- 205 Olive St
- 609 E Willingham St
- 207 Olive St
- 109 Olive St
- 611 E Willingham St
- 212 Olive St
- 604 E Willingham St
- 503 E Willingham St
- 602 E Willingham St
- 606 E Willingham St
- 204 Royal St
- 405 Atlantic St Unit 407
Ask me questions while you tour the home.