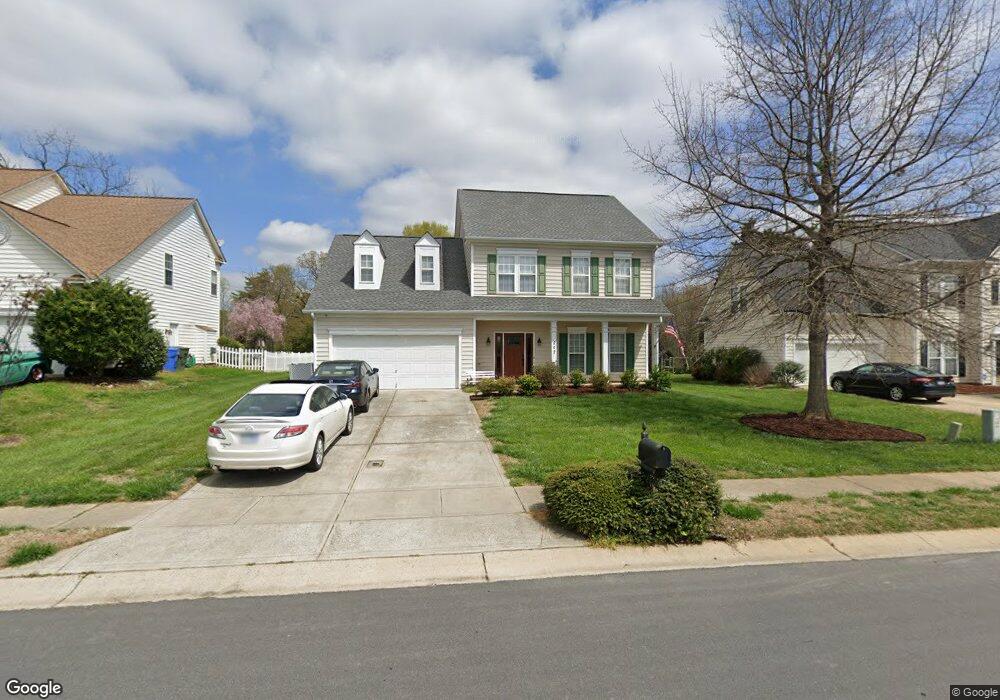
202 Pamlico Ln Mooresville, NC 28117
Estimated Value: $562,000 - $729,000
4
Beds
3
Baths
2,536
Sq Ft
$240/Sq Ft
Est. Value
About This Home
This home is located at 202 Pamlico Ln, Mooresville, NC 28117 and is currently estimated at $609,084, approximately $240 per square foot. 202 Pamlico Ln is a home located in Iredell County with nearby schools including Lake Norman Elementary School, Lake Norman High School, and Langtree Charter Academy.
Ownership History
Date
Name
Owned For
Owner Type
Purchase Details
Closed on
Aug 29, 2000
Sold by
Bowman Tracy and Bowman Patricia L
Bought by
Christopher Kenneth R and Christopher Debra L
Current Estimated Value
Home Financials for this Owner
Home Financials are based on the most recent Mortgage that was taken out on this home.
Original Mortgage
$80,000
Outstanding Balance
$29,446
Interest Rate
8.24%
Estimated Equity
$579,638
Purchase Details
Closed on
Oct 28, 1999
Sold by
Nvr Inc
Bought by
Bowman Tracy and Bowman Patricia L
Home Financials for this Owner
Home Financials are based on the most recent Mortgage that was taken out on this home.
Original Mortgage
$172,100
Interest Rate
11%
Purchase Details
Closed on
Aug 3, 1999
Sold by
Ipswich Bay Ltd Liability Company
Bought by
Nvr Inc
Purchase Details
Closed on
Feb 1, 1996
Create a Home Valuation Report for This Property
The Home Valuation Report is an in-depth analysis detailing your home's value as well as a comparison with similar homes in the area
Home Values in the Area
Average Home Value in this Area
Purchase History
| Date | Buyer | Sale Price | Title Company |
|---|---|---|---|
| Christopher Kenneth R | $196,000 | -- | |
| Bowman Tracy | $181,500 | -- | |
| Nvr Inc | $64,000 | -- | |
| -- | -- | -- |
Source: Public Records
Mortgage History
| Date | Status | Borrower | Loan Amount |
|---|---|---|---|
| Open | Christopher Kenneth R | $80,000 | |
| Previous Owner | Bowman Tracy | $172,100 |
Source: Public Records
Tax History Compared to Growth
Tax History
| Year | Tax Paid | Tax Assessment Tax Assessment Total Assessment is a certain percentage of the fair market value that is determined by local assessors to be the total taxable value of land and additions on the property. | Land | Improvement |
|---|---|---|---|---|
| 2024 | $4,811 | $462,250 | $80,000 | $382,250 |
| 2023 | $4,751 | $462,250 | $80,000 | $382,250 |
| 2022 | $3,645 | $310,080 | $55,000 | $255,080 |
| 2021 | $3,641 | $310,080 | $55,000 | $255,080 |
| 2020 | $3,562 | $302,970 | $55,000 | $247,970 |
| 2019 | $3,531 | $302,970 | $55,000 | $247,970 |
| 2018 | $2,780 | $235,480 | $60,000 | $175,480 |
| 2017 | $2,720 | $235,480 | $60,000 | $175,480 |
| 2016 | $2,720 | $235,480 | $60,000 | $175,480 |
| 2015 | $2,720 | $235,480 | $60,000 | $175,480 |
| 2014 | $2,660 | $239,210 | $60,000 | $179,210 |
Source: Public Records
Map
Nearby Homes
- 220 Chandeleur Dr
- 207 Chandeleur Dr
- 103 Pamlico Ln
- 195 Sundown Rd
- 584 Williamson Rd
- 115 Sunridge Dr
- 168 Mooreland Rd
- 227 Corona Cir Unit 19
- 214 Farmstead Ln
- 637 Williamson Rd Unit 304
- 130 S Gibbs Rd
- 159 S Gibbs Rd
- 127 Hazelton Loop
- 189 Singleton Rd
- 124 Clipper Ln
- 125 Capital Ave
- 315 W Waterlynn Rd
- 103 Quarter Ln
- 108 Certificate St Unit C
- 310 W Waterlynn Rd
- 198 Pamlico Ln
- 206 Pamlico Ln
- 194 Pamlico Ln
- 210 Pamlico Ln
- 190 Pamlico Ln
- 214 Pamlico Ln
- 195 Pamlico Ln
- 186 Pamlico Ln
- 191 Pamlico Ln
- 218 Pamlico Ln
- 187 Pamlico Ln
- 182 Pamlico Ln
- 447 Williamson Rd
- 183 Pamlico Ln
- 178 Pamlico Ln
- 156 Samdusky Ln
- 152 Samdusky Ln
- 179 Pamlico Ln
- 148 Samdusky Ln
- 174 Pamlico Ln