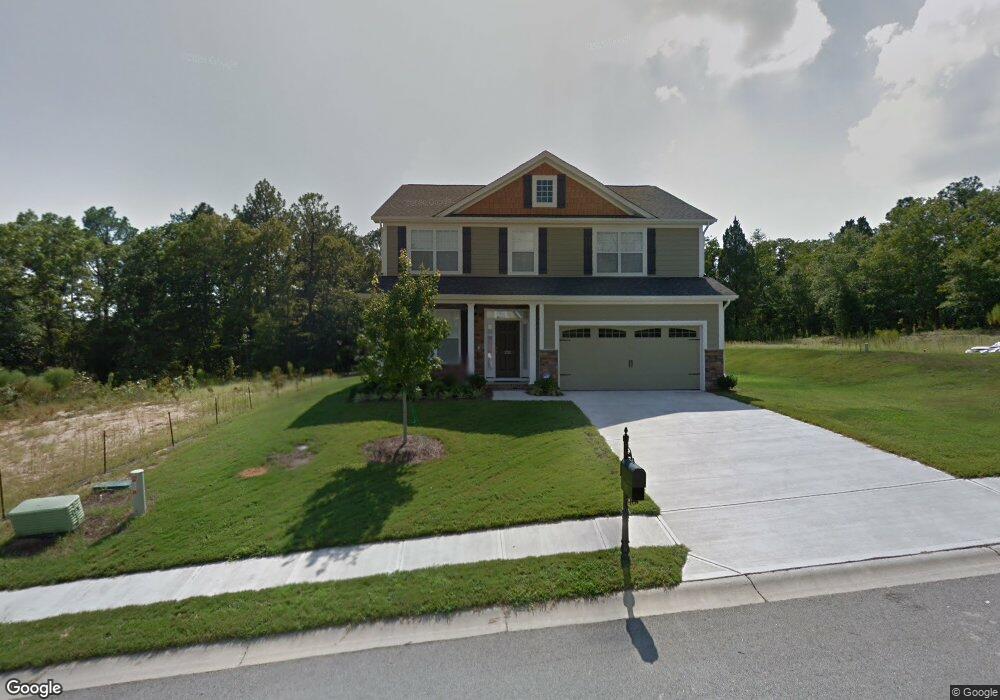
202 Parrish Pond Ct West Columbia, SC 29170
Estimated Value: $367,234 - $428,000
5
Beds
4
Baths
2,740
Sq Ft
$142/Sq Ft
Est. Value
About This Home
This home is located at 202 Parrish Pond Ct, West Columbia, SC 29170 and is currently estimated at $387,809, approximately $141 per square foot. 202 Parrish Pond Ct is a home located in Lexington County with nearby schools including Springdale Elementary School, R. H. Fulmer Middle, and Airport High School.
Ownership History
Date
Name
Owned For
Owner Type
Purchase Details
Closed on
Jan 24, 2018
Sold by
Department Of Veterans Affairs
Bought by
Johnson Herbert L
Current Estimated Value
Home Financials for this Owner
Home Financials are based on the most recent Mortgage that was taken out on this home.
Original Mortgage
$185,000
Outstanding Balance
$156,118
Interest Rate
3.94%
Mortgage Type
VA
Estimated Equity
$231,691
Purchase Details
Closed on
Jul 26, 2017
Sold by
Wells Fargo Bank Na
Bought by
Secretary Of Veterans Affairs
Purchase Details
Closed on
Jul 12, 2017
Sold by
Spence James O and Jones Melton D
Bought by
Wells Fargo Bank
Purchase Details
Closed on
Jul 5, 2016
Sold by
Dr Horton Inc
Bought by
Abney Bertha L
Purchase Details
Closed on
Jul 28, 2015
Sold by
Graves Kevin
Bought by
Jones Melton D
Purchase Details
Closed on
Sep 29, 2010
Sold by
D R Horton Inc
Bought by
Graves Kevin
Purchase Details
Closed on
Sep 15, 2009
Sold by
Parrish Plantation Llc
Bought by
D R Horton Inc
Create a Home Valuation Report for This Property
The Home Valuation Report is an in-depth analysis detailing your home's value as well as a comparison with similar homes in the area
Home Values in the Area
Average Home Value in this Area
Purchase History
| Date | Buyer | Sale Price | Title Company |
|---|---|---|---|
| Johnson Herbert L | $185,000 | None Available | |
| Secretary Of Veterans Affairs | -- | None Available | |
| Wells Fargo Bank | -- | None Available | |
| Abney Bertha L | $157,990 | None Available | |
| Jones Melton D | $204,000 | -- | |
| Graves Kevin | $209,900 | -- | |
| D R Horton Inc | $198,500 | -- |
Source: Public Records
Mortgage History
| Date | Status | Borrower | Loan Amount |
|---|---|---|---|
| Open | Johnson Herbert L | $185,000 |
Source: Public Records
Tax History Compared to Growth
Tax History
| Year | Tax Paid | Tax Assessment Tax Assessment Total Assessment is a certain percentage of the fair market value that is determined by local assessors to be the total taxable value of land and additions on the property. | Land | Improvement |
|---|---|---|---|---|
| 2024 | $1,648 | $8,272 | $1,400 | $6,872 |
| 2023 | $1,648 | $8,272 | $1,400 | $6,872 |
| 2020 | $1,643 | $8,272 | $1,400 | $6,872 |
| 2019 | $1,680 | $8,328 | $1,400 | $6,928 |
| 2018 | $1,697 | $8,328 | $1,400 | $6,928 |
| 2017 | $4,448 | $12,240 | $2,100 | $10,140 |
| 2016 | $4,481 | $12,240 | $2,100 | $10,140 |
| 2014 | $1,305 | $8,348 | $1,200 | $7,148 |
| 2013 | -- | $8,350 | $1,200 | $7,150 |
Source: Public Records
Map
Nearby Homes
- 3318 Hollydale Dr
- 504 Dickson Hill Cir
- 909 Camelot Dr
- 828 Seay Dr
- 256 Judiths Path
- 267 Judiths Path
- 636 Honeydew Dr
- 250 Judiths Path
- 254 Judiths Path
- 265 Judiths Path
- 3211 Oakdale Rd
- 646 Honeydew Dr
- 910 Pond Dr
- The Hollins Plan at Cottages at Roofs Pond
- 276 Judiths Path
- 258 Judiths Path
- 262 Judiths Path
- 260 Judiths Path
- Courtland II Plan at Cottages at Roofs Pond
- Bailey II Plan at Cottages at Roofs Pond
- 206 Parrish Pond Ct
- 322 John Wayne Dr
- 318 John Wayne Dr
- 381 Wattling Rd
- 210 Parrish Pond Ct
- 203 Parrish Pond Ct
- 137 Parrish Pond Dr
- 310 John Wayne Dr
- 210 Parrish Pond Dr
- 536 Dickson Hill Cir
- 540 Dickson Hill Cir
- 118 Parrish Pond Dr
- 215 Parrish Pond Ct
- 126 Parrish Pond Dr
- 524 Dickson Hill Cir
- 130 Parrish Pond Dr
- 532 Dickson Hill Cir
- 520 Dickson Hill Cir
- 129 Parrish Pond Dr
- 110 Parrish Pond Dr