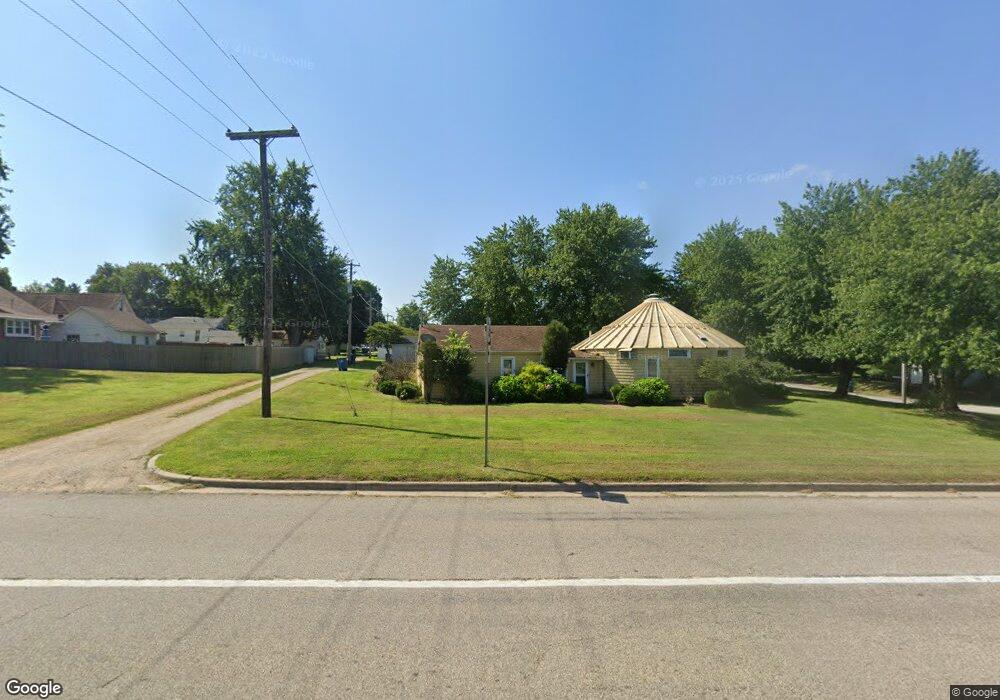
202 Pearl St Covington, IN 47932
Estimated Value: $109,000 - $142,000
Studio
1
Bath
1,231
Sq Ft
$102/Sq Ft
Est. Value
About This Home
This home is located at 202 Pearl St, Covington, IN 47932 and is currently estimated at $125,218, approximately $101 per square foot. 202 Pearl St is a home located in Fountain County with nearby schools including Covington Elementary School, Covington Middle School, and Covington Community High School.
Ownership History
Date
Name
Owned For
Owner Type
Purchase Details
Closed on
Aug 2, 2021
Sold by
Becker Laura L
Bought by
C & C Management Group Llc
Current Estimated Value
Home Financials for this Owner
Home Financials are based on the most recent Mortgage that was taken out on this home.
Original Mortgage
$50,625
Outstanding Balance
$45,534
Interest Rate
2.9%
Mortgage Type
Commercial
Estimated Equity
$79,684
Purchase Details
Closed on
Dec 16, 2013
Sold by
Melvin L Melvin L
Bought by
Becker Laura L
Create a Home Valuation Report for This Property
The Home Valuation Report is an in-depth analysis detailing your home's value as well as a comparison with similar homes in the area
Home Values in the Area
Average Home Value in this Area
Purchase History
| Date | Buyer | Sale Price | Title Company |
|---|---|---|---|
| C & C Management Group Llc | -- | None Available | |
| Becker Laura L | -- | -- |
Source: Public Records
Mortgage History
| Date | Status | Borrower | Loan Amount |
|---|---|---|---|
| Open | C & C Management Group Llc | $50,625 |
Source: Public Records
Tax History
| Year | Tax Paid | Tax Assessment Tax Assessment Total Assessment is a certain percentage of the fair market value that is determined by local assessors to be the total taxable value of land and additions on the property. | Land | Improvement |
|---|---|---|---|---|
| 2024 | $1,738 | $86,900 | $40,300 | $46,600 |
| 2023 | $1,632 | $81,600 | $34,500 | $47,100 |
| 2022 | $1,578 | $78,900 | $34,500 | $44,400 |
| 2021 | $1,522 | $76,100 | $34,500 | $41,600 |
| 2020 | $1,322 | $66,100 | $28,000 | $38,100 |
| 2019 | $1,288 | $64,400 | $28,000 | $36,400 |
| 2018 | $1,224 | $61,200 | $28,300 | $32,900 |
| 2017 | $1,182 | $59,100 | $28,300 | $30,800 |
| 2016 | $1,220 | $62,100 | $28,300 | $33,800 |
| 2014 | $1,214 | $60,700 | $28,300 | $32,400 |
| 2013 | $1,214 | $69,400 | $28,300 | $41,100 |
Source: Public Records
Map
Nearby Homes
Your Personal Tour Guide
Ask me questions while you tour the home.