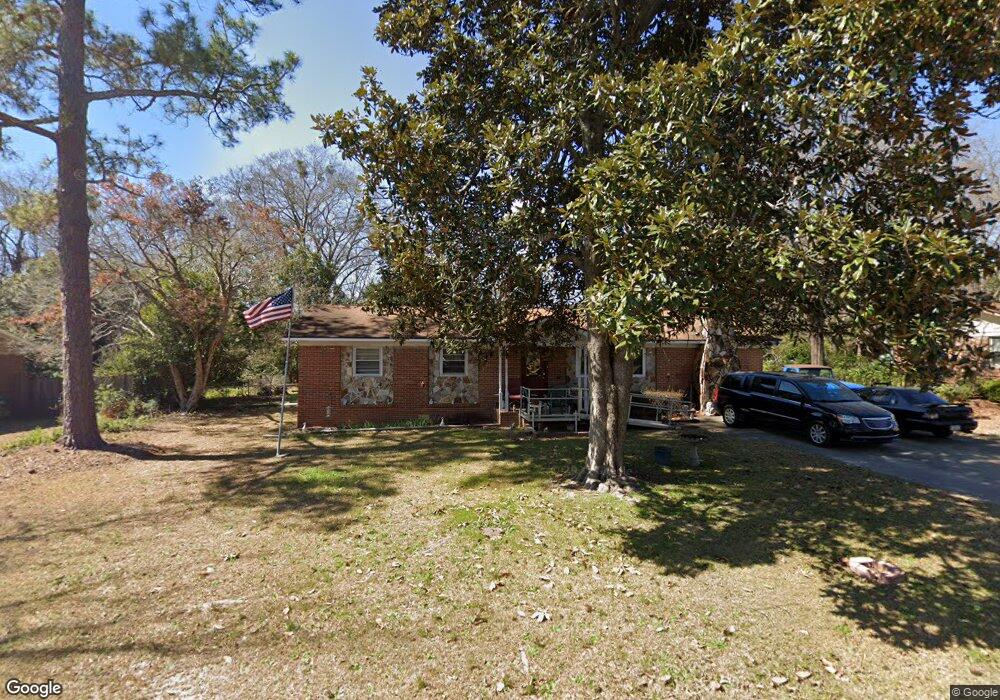
202 Pinecrest Dr Warner Robins, GA 31093
Estimated Value: $156,000 - $188,000
3
Beds
2
Baths
1,456
Sq Ft
$119/Sq Ft
Est. Value
About This Home
This home is located at 202 Pinecrest Dr, Warner Robins, GA 31093 and is currently estimated at $172,644, approximately $118 per square foot. 202 Pinecrest Dr is a home located in Houston County with nearby schools including Westside Elementary School, Northside Middle School, and Northside High School.
Ownership History
Date
Name
Owned For
Owner Type
Purchase Details
Closed on
Sep 24, 2024
Sold by
Duff George A and Duff Nancy L
Bought by
Duff George A and Duff Nancy L
Current Estimated Value
Purchase Details
Closed on
Dec 2, 2021
Sold by
Sabet David A and Sabet Terri A
Bought by
Duff George Albert and Duff Nancy Lee
Purchase Details
Closed on
Apr 30, 2003
Sold by
Caldwell Suzette J F and Caldwell K
Bought by
Sabet David A and Terri A*
Purchase Details
Closed on
Feb 21, 2003
Sold by
Hawkins Don W
Bought by
Caldwell Suzette J
Purchase Details
Closed on
May 30, 1986
Sold by
Corrective Deed
Bought by
Hawkins Don W and Hawkins Suzette J
Purchase Details
Closed on
May 31, 1985
Sold by
Beckworth Robert H and Martha Fa
Bought by
Hawkins Don W and Hawkins Suzette J
Purchase Details
Closed on
Jan 23, 1968
Sold by
Tower Inc
Bought by
Beckworth Robert H and Martha Faye
Purchase Details
Closed on
Aug 11, 1967
Bought by
Tower Inc
Create a Home Valuation Report for This Property
The Home Valuation Report is an in-depth analysis detailing your home's value as well as a comparison with similar homes in the area
Home Values in the Area
Average Home Value in this Area
Purchase History
| Date | Buyer | Sale Price | Title Company |
|---|---|---|---|
| Duff George A | -- | None Listed On Document | |
| Duff George A | -- | None Listed On Document | |
| Duff George Albert | $54,000 | None Available | |
| Sabet David A | $54,000 | -- | |
| Caldwell Suzette J | -- | -- | |
| Hawkins Don W | -- | -- | |
| Hawkins Don W | -- | -- | |
| Beckworth Robert H | -- | -- | |
| Tower Inc | -- | -- |
Source: Public Records
Tax History
| Year | Tax Paid | Tax Assessment Tax Assessment Total Assessment is a certain percentage of the fair market value that is determined by local assessors to be the total taxable value of land and additions on the property. | Land | Improvement |
|---|---|---|---|---|
| 2024 | $847 | $44,520 | $6,200 | $38,320 |
| 2023 | $693 | $37,760 | $6,200 | $31,560 |
| 2022 | $807 | $33,400 | $5,000 | $28,400 |
| 2021 | $741 | $30,520 | $5,000 | $25,520 |
| 2020 | $727 | $29,800 | $5,000 | $24,800 |
| 2019 | $727 | $29,800 | $5,000 | $24,800 |
| 2018 | $727 | $29,800 | $5,000 | $24,800 |
| 2017 | $728 | $29,800 | $5,000 | $24,800 |
| 2016 | $729 | $29,800 | $5,000 | $24,800 |
| 2015 | $731 | $29,800 | $5,000 | $24,800 |
| 2014 | -- | $29,800 | $5,000 | $24,800 |
| 2013 | -- | $28,840 | $5,000 | $23,840 |
Source: Public Records
Map
Nearby Homes
- 104 Heather St
- 102 Hemlock St
- 3220 Mason Dr
- 110 Wray St
- 101 Wray St
- 111 Hawthorne Rd
- 201 Eagles Landing Trail
- 221 Gilchrist Dr
- 110 Foxfire Dr
- 123 Tanglewood Dr
- 112 Emory Dr
- 208 Pellimore Dr
- 203 Gawin Dr
- 102 Pine Glen Ct
- 108 Madison Ave
- 218 Valencia Cir
- 156 Red Birch Ln
- 118 Red Birch Ln
- 136 Red Birch Ln
- 202 Magnolia Glen
- 200 Pinecrest Dr
- 204 Pinecrest Dr
- 201 Pinecrest Rd
- 200 Heather St
- 202 Heather St
- 3180 Mason Dr
- 205 Pinecrest Dr
- 201 Pinecrest Dr
- 110 Heather St
- 204 Heather St
- 3160 Mason Dr
- 108 Heather St
- 206 Heather St
- 300 Pinecrest Dr
- 3120 Mason Dr
- 3251 Mason Dr
- 101 Redbud Cir
- 106 Heather St
- 208 Heather St
- 301 Pinecrest Dr
Your Personal Tour Guide
Ask me questions while you tour the home.