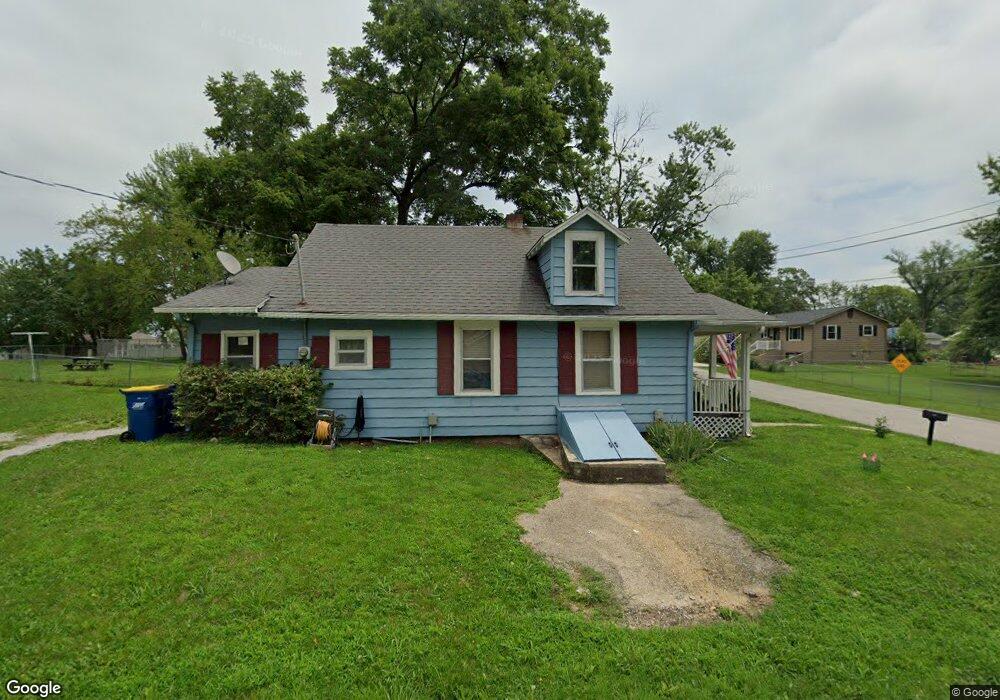
202 Ridgeway St Excelsior Springs, MO 64024
Estimated Value: $171,000 - $199,000
4
Beds
1
Bath
1,000
Sq Ft
$183/Sq Ft
Est. Value
About This Home
This home is located at 202 Ridgeway St, Excelsior Springs, MO 64024 and is currently estimated at $182,517, approximately $182 per square foot. 202 Ridgeway St is a home located in Clay County with nearby schools including Excelsior Springs High School.
Ownership History
Date
Name
Owned For
Owner Type
Purchase Details
Closed on
May 3, 2021
Sold by
Grosko Sarah E
Bought by
Grosko Joshua L
Current Estimated Value
Home Financials for this Owner
Home Financials are based on the most recent Mortgage that was taken out on this home.
Original Mortgage
$55,000
Outstanding Balance
$49,844
Interest Rate
3.1%
Mortgage Type
New Conventional
Estimated Equity
$132,673
Purchase Details
Closed on
Dec 4, 2002
Sold by
Bishop Michial B and Bishop Kristi L
Bought by
Grosko Joshua L and Grosko Sarah E
Home Financials for this Owner
Home Financials are based on the most recent Mortgage that was taken out on this home.
Original Mortgage
$62,704
Interest Rate
6.05%
Purchase Details
Closed on
Jun 27, 2001
Sold by
Mckown David L and Mckown Shelley Y
Bought by
Bishop Michial B and Bishop Kristi L
Purchase Details
Closed on
Mar 16, 2001
Sold by
Woodside Herman K
Bought by
Mckown David L and Mckown Shelley Y
Create a Home Valuation Report for This Property
The Home Valuation Report is an in-depth analysis detailing your home's value as well as a comparison with similar homes in the area
Home Values in the Area
Average Home Value in this Area
Purchase History
| Date | Buyer | Sale Price | Title Company |
|---|---|---|---|
| Grosko Joshua L | -- | Trusted Title & Closing | |
| Grosko Joshua L | -- | Stewart Title | |
| Bishop Michial B | -- | First American Title Ins Co | |
| Mckown David L | -- | Excelsior Abstract & Title C |
Source: Public Records
Mortgage History
| Date | Status | Borrower | Loan Amount |
|---|---|---|---|
| Open | Grosko Joshua L | $55,000 | |
| Closed | Grosko Joshua L | $62,704 |
Source: Public Records
Tax History Compared to Growth
Tax History
| Year | Tax Paid | Tax Assessment Tax Assessment Total Assessment is a certain percentage of the fair market value that is determined by local assessors to be the total taxable value of land and additions on the property. | Land | Improvement |
|---|---|---|---|---|
| 2025 | $1,078 | $20,770 | -- | -- |
| 2024 | $1,078 | $15,370 | -- | -- |
| 2023 | $1,071 | $15,370 | $0 | $0 |
| 2022 | $950 | $13,410 | $0 | $0 |
| 2021 | $954 | $13,414 | $1,900 | $11,514 |
| 2020 | $925 | $12,640 | $0 | $0 |
| 2019 | $924 | $12,635 | $1,900 | $10,735 |
| 2018 | $900 | $12,270 | $0 | $0 |
| 2017 | $878 | $12,270 | $1,900 | $10,370 |
| 2016 | $878 | $12,270 | $1,900 | $10,370 |
| 2015 | $886 | $12,270 | $1,900 | $10,370 |
| 2014 | $812 | $11,150 | $1,900 | $9,250 |
Source: Public Records
Map
Nearby Homes
- 110 Ridgeway St
- 214 Oakwood Ave
- 1229 Michele Dr
- 934 Williams St
- 936 St Paul Ave
- 507 N Kimball St
- 400 Beverly Ave
- 1101 Williams St
- 1017 Rose Ave
- 0 Meadowlark Ln
- 211 Carla St
- 101 W Excelsior St
- 332 Woods Ave
- 1318 Kristie Cir
- 124 Wildwood St
- 106 Helen St
- 304 Waller Ave
- 256 E Broadway Ave
- 106 Saratoga St
- 115 Saratoga Ave