Estimated Value: $260,000 - $409,000
--
Bed
--
Bath
2,448
Sq Ft
$135/Sq Ft
Est. Value
About This Home
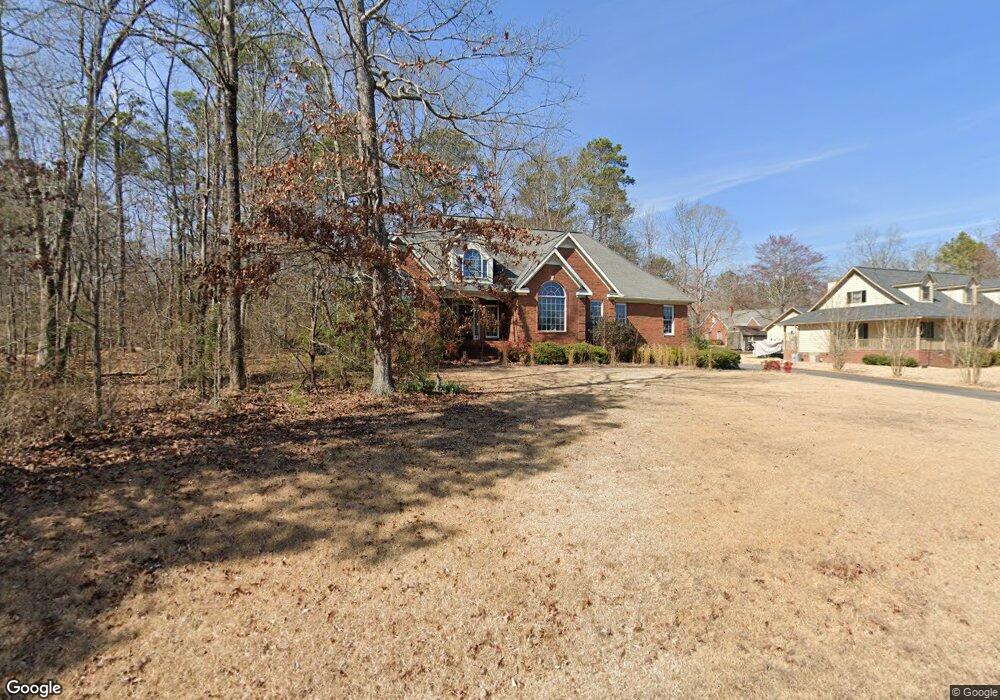
This home is located at 202 Rolling Pines Rd NW, Rome, GA 30165 and is currently estimated at $330,943, approximately $135 per square foot. 202 Rolling Pines Rd NW is a home located in Floyd County with nearby schools including Rome High School.
Ownership History
Date
Name
Owned For
Owner Type
Purchase Details
Closed on
Apr 16, 2025
Sold by
West James L
Bought by
Ksc Cowan Properties Llc
Current Estimated Value
Purchase Details
Closed on
Jul 22, 2011
Sold by
West Debbi W
Bought by
West James L
Home Financials for this Owner
Home Financials are based on the most recent Mortgage that was taken out on this home.
Original Mortgage
$157,500
Interest Rate
4.52%
Mortgage Type
New Conventional
Purchase Details
Closed on
Jul 12, 1996
Sold by
Whittle Lydell and Whittle Barbara
Bought by
West James L and West Debbi W
Purchase Details
Closed on
Feb 11, 1991
Sold by
Garden Lakes Company Inc The
Bought by
Whittle Lydell and Whittle Barbara
Purchase Details
Closed on
Apr 20, 1988
Sold by
Lakes Recreation Inc
Bought by
Garden Lakes Company Inc The
Purchase Details
Closed on
Jul 10, 1985
Bought by
P and R
Purchase Details
Closed on
Sep 27, 1983
Bought by
P and R
Purchase Details
Closed on
Jan 1, 1982
Bought by
P and R
Create a Home Valuation Report for This Property
The Home Valuation Report is an in-depth analysis detailing your home's value as well as a comparison with similar homes in the area
Home Values in the Area
Average Home Value in this Area
Purchase History
| Date | Buyer | Sale Price | Title Company |
|---|---|---|---|
| Ksc Cowan Properties Llc | $259,000 | -- | |
| West James L | -- | -- | |
| West James L | $20,500 | -- | |
| Whittle Lydell | $18,900 | -- | |
| Garden Lakes Company Inc The | -- | -- | |
| P | -- | -- | |
| P | -- | -- | |
| P | -- | -- | |
| Lakes Recreation Inc | -- | -- |
Source: Public Records
Mortgage History
| Date | Status | Borrower | Loan Amount |
|---|---|---|---|
| Previous Owner | West James L | $157,500 |
Source: Public Records
Tax History Compared to Growth
Tax History
| Year | Tax Paid | Tax Assessment Tax Assessment Total Assessment is a certain percentage of the fair market value that is determined by local assessors to be the total taxable value of land and additions on the property. | Land | Improvement |
|---|---|---|---|---|
| 2024 | $2,709 | $148,094 | $19,354 | $128,740 |
| 2023 | $3,533 | $134,591 | $17,203 | $117,388 |
| 2022 | $3,049 | $113,883 | $13,978 | $99,905 |
| 2021 | $3,653 | $105,483 | $13,978 | $91,505 |
| 2020 | $3,560 | $98,476 | $10,752 | $87,724 |
| 2019 | $3,459 | $94,720 | $10,752 | $83,968 |
| 2018 | $3,360 | $90,766 | $10,752 | $80,014 |
| 2017 | $3,236 | $87,417 | $10,752 | $76,665 |
| 2016 | $3,202 | $86,228 | $10,720 | $75,508 |
| 2015 | $3,129 | $87,148 | $10,720 | $76,428 |
| 2014 | $3,129 | $89,221 | $10,720 | $78,501 |
Source: Public Records
Map
Nearby Homes
- 116 Rolling Pines Rd NW
- 203 Rolling Pines Rd NW
- 203 Rolling Pines Rd NW
- 120 Windwood Way NW
- 118 Windwood Way NW
- 118 Windwood Way NW
- 201 Rolling Pines Rd NW
- 0 Rolling Pines Rd Unit 8722104
- 0 Rolling Pines Rd Unit 8621264
- 0 Rolling Pines Rd Unit 8722097
- 0 Rolling Pines Rd Unit 8863530
- 204 Rolling Pines Rd
- 0 Rolling Pines Rd Unit 7014793
- 0 Rolling Pines Rd Unit 7305512
- 0 Rolling Pines Rd Unit 8066906
- 0 Rolling Pines Rd Unit 8133756
- 0 Rolling Pines Rd Unit 8303598
- 0 Rolling Pines Rd Unit 8515298
- 0 Rolling Pines Rd
- 206 Rolling Pines Rd NW