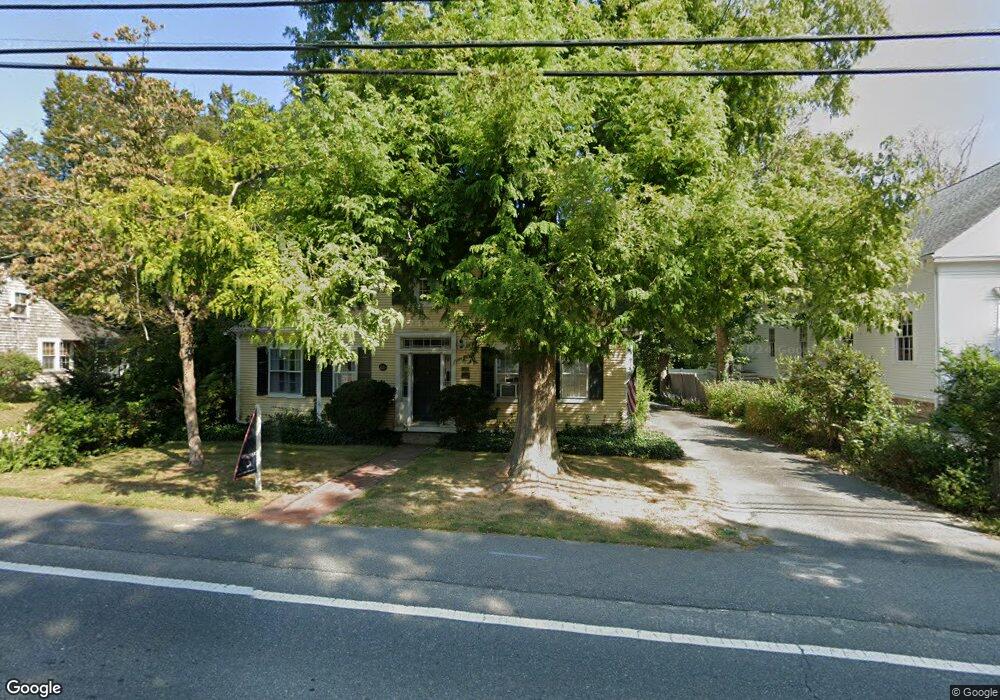
202 Route 6a Yarmouth Port, MA 02675
Yarmouth Port NeighborhoodEstimated Value: $863,111 - $1,132,000
4
Beds
2
Baths
2,201
Sq Ft
$433/Sq Ft
Est. Value
About This Home
This home is located at 202 Route 6a, Yarmouth Port, MA 02675 and is currently estimated at $953,528, approximately $433 per square foot. 202 Route 6a is a home located in Barnstable County with nearby schools including Dennis-Yarmouth Regional High School, Trinity Christian Academy of Cape Cod, and St. Pius X. School.
Ownership History
Date
Name
Owned For
Owner Type
Purchase Details
Closed on
Jan 4, 2022
Sold by
Alberti Jeannette
Bought by
Elseherawey-Oneill Amani
Current Estimated Value
Home Financials for this Owner
Home Financials are based on the most recent Mortgage that was taken out on this home.
Original Mortgage
$392,500
Outstanding Balance
$360,254
Interest Rate
3.11%
Mortgage Type
Purchase Money Mortgage
Estimated Equity
$593,274
Purchase Details
Closed on
Aug 23, 1995
Sold by
202 Hallet St Rt and Leedom
Bought by
Alberti Nicholas W and Alberti Jeannette
Home Financials for this Owner
Home Financials are based on the most recent Mortgage that was taken out on this home.
Original Mortgage
$60,000
Interest Rate
7.32%
Mortgage Type
Purchase Money Mortgage
Create a Home Valuation Report for This Property
The Home Valuation Report is an in-depth analysis detailing your home's value as well as a comparison with similar homes in the area
Home Values in the Area
Average Home Value in this Area
Purchase History
| Date | Buyer | Sale Price | Title Company |
|---|---|---|---|
| Elseherawey-Oneill Amani | $602,500 | None Available | |
| Alberti Nicholas W | $215,000 | -- |
Source: Public Records
Mortgage History
| Date | Status | Borrower | Loan Amount |
|---|---|---|---|
| Open | Elseherawey-Oneill Amani | $392,500 | |
| Previous Owner | Alberti Nicholas W | $60,000 |
Source: Public Records
Tax History Compared to Growth
Tax History
| Year | Tax Paid | Tax Assessment Tax Assessment Total Assessment is a certain percentage of the fair market value that is determined by local assessors to be the total taxable value of land and additions on the property. | Land | Improvement |
|---|---|---|---|---|
| 2025 | $4,659 | $658,000 | $338,700 | $319,300 |
| 2024 | $4,296 | $582,100 | $294,800 | $287,300 |
| 2023 | $5,104 | $629,300 | $248,800 | $380,500 |
| 2022 | $4,909 | $534,700 | $223,400 | $311,300 |
| 2021 | $4,449 | $465,400 | $209,900 | $255,500 |
| 2020 | $4,902 | $490,200 | $201,200 | $289,000 |
| 2019 | $4,951 | $490,200 | $201,200 | $289,000 |
| 2018 | $4,941 | $480,200 | $191,200 | $289,000 |
| 2017 | $4,812 | $480,200 | $191,200 | $289,000 |
| 2016 | $4,792 | $480,200 | $191,200 | $289,000 |
| 2015 | $5,124 | $510,400 | $191,200 | $319,200 |
Source: Public Records
Map
Nearby Homes
- 186 Route 6a
- 162 Route 6a
- 116 Main St
- 116 Main (Route 6a) St
- 112 Main St
- 56 Wharf Ln
- 371 Route 6a
- 105 Old Hyannis Rd
- 25 Congressional Dr
- 4390 Main St
- 33 Midpine Rd
- 933-935 W Yarmouth Rd
- 34 Ridgewood Dr
- 882 W Yarmouth Rd
- 81 Desert Sands Ln
- 23 Dauphine Dr
- 99 Old Hyannis Rd
- 24 Minnetuxet Way
- 67 Spy Glass Hill Rd
- 111 Old Hyannis Rd