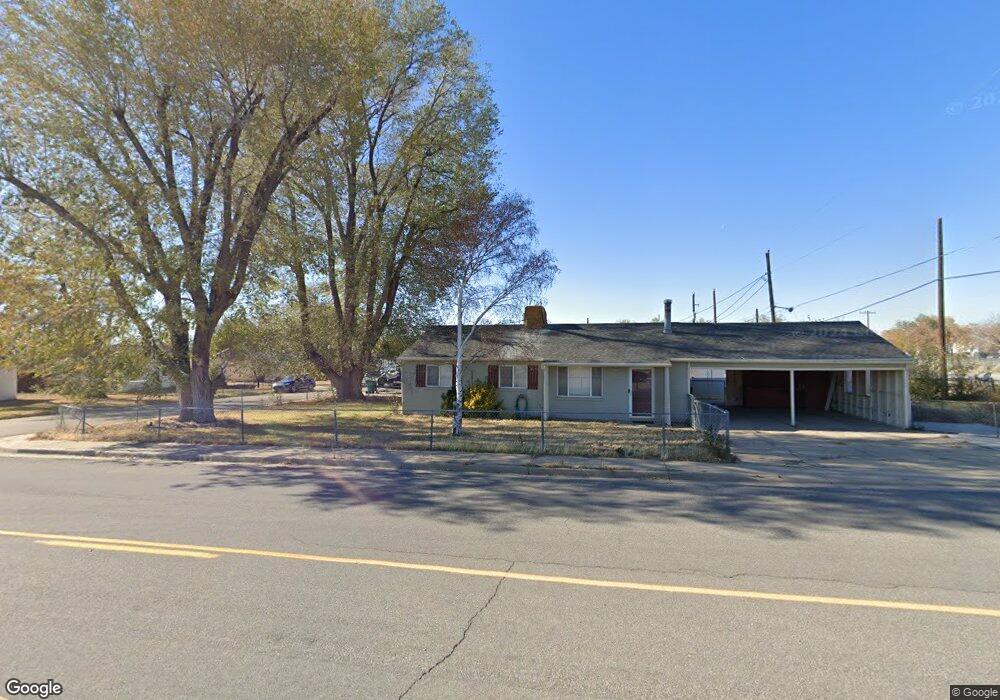
202 S 1000 E Clearfield, UT 84015
Estimated Value: $323,000 - $377,000
3
Beds
1
Bath
936
Sq Ft
$375/Sq Ft
Est. Value
About This Home
This home is located at 202 S 1000 E, Clearfield, UT 84015 and is currently estimated at $350,619, approximately $374 per square foot. 202 S 1000 E is a home located in Davis County with nearby schools including Hill Field Elementary School, North Davis Junior High School, and Clearfield High School.
Ownership History
Date
Name
Owned For
Owner Type
Purchase Details
Closed on
Sep 10, 2021
Sold by
Javier Jimmy
Bought by
Bachtar Calvin
Current Estimated Value
Home Financials for this Owner
Home Financials are based on the most recent Mortgage that was taken out on this home.
Original Mortgage
$276,450
Outstanding Balance
$251,000
Interest Rate
2.8%
Mortgage Type
New Conventional
Estimated Equity
$99,619
Purchase Details
Closed on
May 7, 2020
Sold by
Nelson Tyler and Nelson Emily
Bought by
Javier Jimmy
Home Financials for this Owner
Home Financials are based on the most recent Mortgage that was taken out on this home.
Original Mortgage
$12,371
Interest Rate
3.3%
Mortgage Type
Stand Alone Second
Purchase Details
Closed on
Aug 16, 2017
Sold by
Shepherd Scott R
Bought by
Cazamm Enterproses Llc
Purchase Details
Closed on
Jun 28, 2005
Sold by
Shepherd Scott R
Bought by
Shepherd Scott R and Shepherd Cindy L
Create a Home Valuation Report for This Property
The Home Valuation Report is an in-depth analysis detailing your home's value as well as a comparison with similar homes in the area
Home Values in the Area
Average Home Value in this Area
Purchase History
| Date | Buyer | Sale Price | Title Company |
|---|---|---|---|
| Bachtar Calvin | -- | Title Guarantee | |
| Javier Jimmy | -- | Truly Title Inc | |
| Cazamm Enterproses Llc | -- | Foundres Title | |
| Shepherd Scott R | -- | -- |
Source: Public Records
Mortgage History
| Date | Status | Borrower | Loan Amount |
|---|---|---|---|
| Open | Bachtar Calvin | $276,450 | |
| Previous Owner | Javier Jimmy | $12,371 | |
| Previous Owner | Javier Jimmy | $206,196 |
Source: Public Records
Tax History Compared to Growth
Tax History
| Year | Tax Paid | Tax Assessment Tax Assessment Total Assessment is a certain percentage of the fair market value that is determined by local assessors to be the total taxable value of land and additions on the property. | Land | Improvement |
|---|---|---|---|---|
| 2025 | $1,645 | $149,600 | $67,257 | $82,343 |
| 2024 | $1,645 | $148,500 | $64,310 | $84,190 |
| 2023 | $1,563 | $259,000 | $103,059 | $155,941 |
| 2022 | $1,657 | $148,500 | $59,256 | $89,244 |
| 2021 | $346 | $210,000 | $62,148 | $147,852 |
| 2020 | $1,205 | $162,000 | $52,127 | $109,873 |
| 2019 | $1,190 | $158,000 | $55,143 | $102,857 |
| 2018 | $1,052 | $136,000 | $46,498 | $89,502 |
| 2016 | $923 | $62,425 | $19,501 | $42,924 |
| 2015 | $828 | $53,350 | $19,501 | $33,849 |
| 2014 | $828 | $54,103 | $19,501 | $34,602 |
| 2013 | -- | $46,089 | $17,718 | $28,371 |
Source: Public Records
Map
Nearby Homes