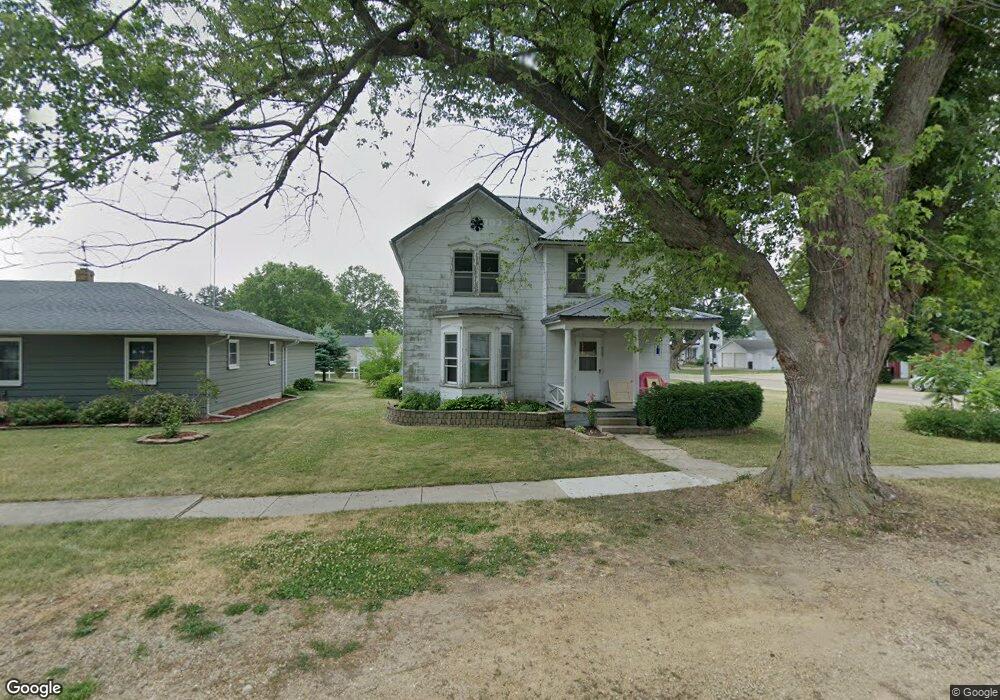
202 S 4th Ave Forreston, IL 61030
Estimated Value: $73,000 - $126,000
Studio
--
Bath
1,664
Sq Ft
$56/Sq Ft
Est. Value
About This Home
This home is located at 202 S 4th Ave, Forreston, IL 61030 and is currently estimated at $93,280, approximately $56 per square foot. 202 S 4th Ave is a home located in Ogle County with nearby schools including Forreston High School.
Ownership History
Date
Name
Owned For
Owner Type
Purchase Details
Closed on
Jan 14, 2016
Sold by
Allen Bodi and Allen Ashley T
Bought by
Allen Estella
Current Estimated Value
Home Financials for this Owner
Home Financials are based on the most recent Mortgage that was taken out on this home.
Original Mortgage
$32,000
Outstanding Balance
$25,425
Interest Rate
3.93%
Mortgage Type
New Conventional
Estimated Equity
$67,855
Purchase Details
Closed on
Feb 1, 2013
Sold by
Ross Brian J
Bought by
Allen Bodi
Home Financials for this Owner
Home Financials are based on the most recent Mortgage that was taken out on this home.
Original Mortgage
$32,000
Interest Rate
3.34%
Mortgage Type
New Conventional
Purchase Details
Closed on
Jan 7, 2013
Sold by
Grigsby Jack L and Grigsby Mary Beth
Bought by
Ross Brian J and Grigsby Jack L
Home Financials for this Owner
Home Financials are based on the most recent Mortgage that was taken out on this home.
Original Mortgage
$32,000
Interest Rate
3.34%
Mortgage Type
New Conventional
Create a Home Valuation Report for This Property
The Home Valuation Report is an in-depth analysis detailing your home's value as well as a comparison with similar homes in the area
Home Values in the Area
Average Home Value in this Area
Purchase History
| Date | Buyer | Sale Price | Title Company |
|---|---|---|---|
| Allen Estella | $20,253 | Security First Title | |
| Allen Bodi | $40,000 | Security First Title Co | |
| Ross Brian J | $34,100 | Security First Title Co |
Source: Public Records
Mortgage History
| Date | Status | Borrower | Loan Amount |
|---|---|---|---|
| Open | Allen Estella | $32,000 | |
| Closed | Allen Bodi | $32,000 | |
| Closed | Ross Brian J | $31,000 |
Source: Public Records
Tax History
| Year | Tax Paid | Tax Assessment Tax Assessment Total Assessment is a certain percentage of the fair market value that is determined by local assessors to be the total taxable value of land and additions on the property. | Land | Improvement |
|---|---|---|---|---|
| 2024 | $1,567 | $17,795 | $2,623 | $15,172 |
| 2023 | $1,465 | $16,599 | $2,447 | $14,152 |
| 2022 | $1,389 | $15,188 | $2,239 | $12,949 |
| 2021 | $1,361 | $14,809 | $2,183 | $12,626 |
| 2020 | $1,331 | $14,547 | $2,144 | $12,403 |
| 2019 | $1,304 | $13,954 | $2,057 | $11,897 |
| 2018 | $1,321 | $13,954 | $2,057 | $11,897 |
| 2017 | $1,342 | $13,954 | $2,057 | $11,897 |
| 2016 | $782 | $13,623 | $2,008 | $11,615 |
| 2015 | $1,283 | $13,304 | $1,961 | $11,343 |
| 2014 | $1,292 | $13,304 | $1,961 | $11,343 |
| 2013 | -- | $13,635 | $2,010 | $11,625 |
Source: Public Records
Map
Nearby Homes
- 406 W Balsam St
- 304 Maple Ave
- 502 N Walnut Ave
- 601 Hewitt St
- 603 Hewitt St
- 609 Hewitt St
- 613 Hewitt St
- 617 Hewitt St
- 605 & 607 Hewitt St
- 613 & 615 Hewitt St
- 609 & 611 Hewitt St
- 617 & 619 Hewitt St
- 701 Hewitt St
- 404 E Willow St
- 703 Hewitt St
- 702 Hewitt St
- 605 Hewitt St
- 8701 N Main St
- 8976 N Main St
- 10225 N Brookville Rd
Your Personal Tour Guide
Ask me questions while you tour the home.