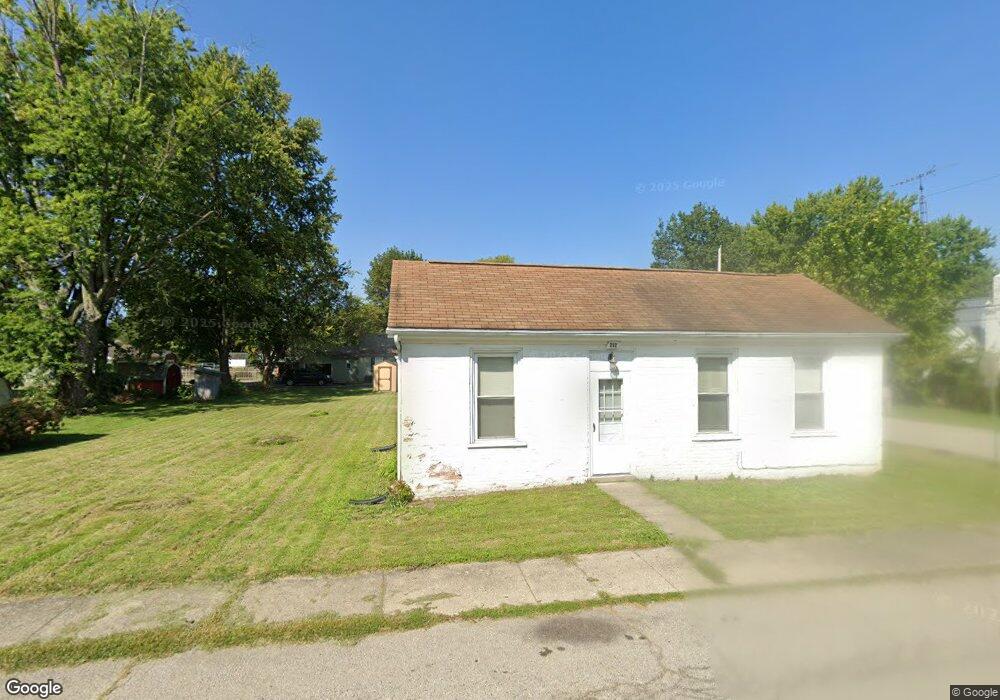
202 S Ash St Centerville, IN 47330
Estimated Value: $127,000 - $131,000
2
Beds
1
Bath
1,132
Sq Ft
$114/Sq Ft
Est. Value
About This Home
This home is located at 202 S Ash St, Centerville, IN 47330 and is currently estimated at $129,187, approximately $114 per square foot. 202 S Ash St is a home located in Wayne County with nearby schools including Rose Hamilton Elementary School, Centerville-Abington Elementary School, and Centerville-Abington Junior High School.
Ownership History
Date
Name
Owned For
Owner Type
Purchase Details
Closed on
Mar 1, 2012
Sold by
Sexton Nancy
Bought by
Brunton Ii Mark
Current Estimated Value
Purchase Details
Closed on
Jun 25, 2007
Sold by
Williams James Allen
Bought by
Sexton Nancy
Home Financials for this Owner
Home Financials are based on the most recent Mortgage that was taken out on this home.
Original Mortgage
$52,110
Interest Rate
6.26%
Mortgage Type
New Conventional
Create a Home Valuation Report for This Property
The Home Valuation Report is an in-depth analysis detailing your home's value as well as a comparison with similar homes in the area
Home Values in the Area
Average Home Value in this Area
Purchase History
| Date | Buyer | Sale Price | Title Company |
|---|---|---|---|
| Brunton Ii Mark | -- | None Available | |
| Sexton Nancy | -- | -- |
Source: Public Records
Mortgage History
| Date | Status | Borrower | Loan Amount |
|---|---|---|---|
| Previous Owner | Sexton Nancy | $52,110 |
Source: Public Records
Tax History
| Year | Tax Paid | Tax Assessment Tax Assessment Total Assessment is a certain percentage of the fair market value that is determined by local assessors to be the total taxable value of land and additions on the property. | Land | Improvement |
|---|---|---|---|---|
| 2025 | $1,036 | $60,400 | $16,100 | $44,300 |
| 2024 | $1,036 | $51,800 | $13,700 | $38,100 |
| 2023 | $9 | $46,700 | $12,400 | $34,300 |
| 2022 | $776 | $38,800 | $12,400 | $26,400 |
| 2021 | $726 | $36,300 | $12,400 | $23,900 |
| 2020 | $720 | $36,000 | $12,400 | $23,600 |
| 2019 | $734 | $36,700 | $12,400 | $24,300 |
| 2018 | $670 | $33,500 | $12,400 | $21,100 |
| 2017 | $664 | $33,200 | $12,400 | $20,800 |
| 2016 | $664 | $33,200 | $12,400 | $20,800 |
| 2014 | $556 | $27,300 | $12,400 | $14,900 |
| 2013 | $556 | $28,800 | $12,400 | $16,400 |
Source: Public Records
Map
Nearby Homes
- 122 W Main St
- 119 W Main St
- 120 W Main St
- 512 W Sycamore St
- 204 S Mcminn Rd
- 311 E South St
- 1664 S Centerville Rd
- 403 Beech Ave
- 502 N 1st St
- 409 Mattie Harris Rd
- 212 Winding Brook Dr
- 400 Deerfield Way
- 200 Winding Brook Dr
- 207 College Corner Rd
- 400 Winding Brook Dr
- 1317 Kellam Rd
- 541 N Centerville Rd
- 7842 College Corner Rd
- 0 Airport Rd Unit 10039926
- 3120 S Centerville Rd
Your Personal Tour Guide
Ask me questions while you tour the home.