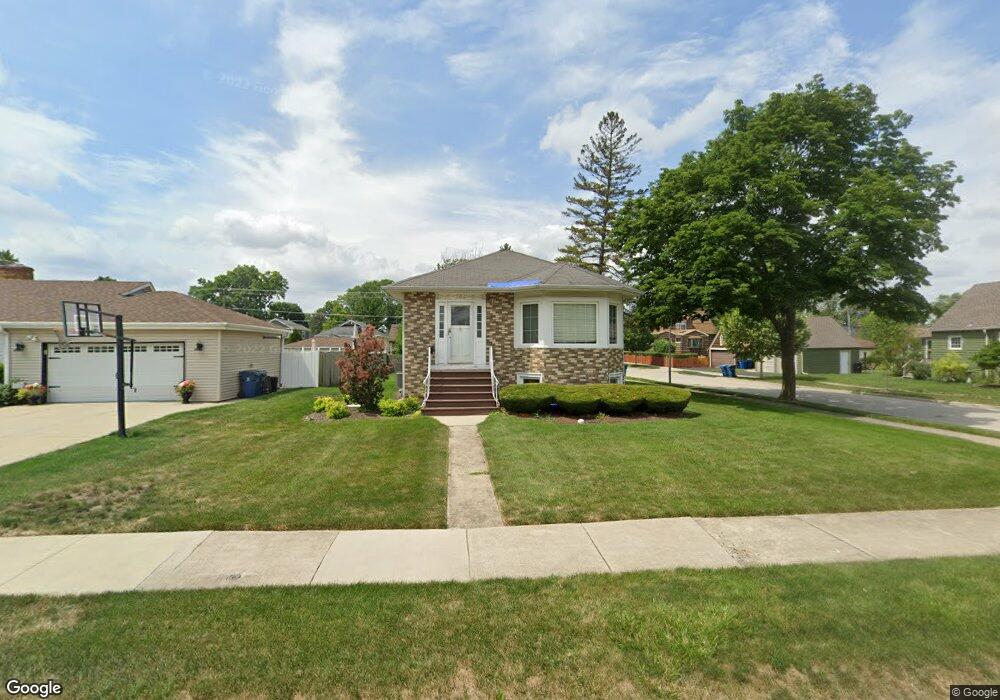
202 S Pick Ave Elmhurst, IL 60126
Estimated Value: $338,712 - $390,000
5
Beds
--
Bath
966
Sq Ft
$382/Sq Ft
Est. Value
About This Home
This home is located at 202 S Pick Ave, Elmhurst, IL 60126 and is currently estimated at $368,928, approximately $381 per square foot. 202 S Pick Ave is a home located in DuPage County with nearby schools including North Elementary School, Jefferson Middle School, and Willowbrook High School.
Ownership History
Date
Name
Owned For
Owner Type
Purchase Details
Closed on
Jun 30, 2004
Sold by
Popowski Andrzej
Bought by
Lang Karl J and Lang Antonette M
Current Estimated Value
Home Financials for this Owner
Home Financials are based on the most recent Mortgage that was taken out on this home.
Original Mortgage
$218,225
Outstanding Balance
$110,446
Interest Rate
6.42%
Mortgage Type
FHA
Estimated Equity
$258,482
Purchase Details
Closed on
Aug 29, 2003
Sold by
Hartley Lisa C and Lisa C Hartley Personal Trust
Bought by
Popowski Andrzej
Home Financials for this Owner
Home Financials are based on the most recent Mortgage that was taken out on this home.
Original Mortgage
$160,000
Interest Rate
5.37%
Mortgage Type
Purchase Money Mortgage
Purchase Details
Closed on
Nov 12, 1997
Sold by
Hartley Michael W
Bought by
The Lisa C Hartley Personal Trust
Create a Home Valuation Report for This Property
The Home Valuation Report is an in-depth analysis detailing your home's value as well as a comparison with similar homes in the area
Home Values in the Area
Average Home Value in this Area
Purchase History
| Date | Buyer | Sale Price | Title Company |
|---|---|---|---|
| Lang Karl J | $252,500 | Stewart Title Guaranty Compa | |
| Popowski Andrzej | $200,500 | Ticor Title Insurance Compan | |
| The Lisa C Hartley Personal Trust | -- | -- |
Source: Public Records
Mortgage History
| Date | Status | Borrower | Loan Amount |
|---|---|---|---|
| Open | Lang Karl J | $218,225 | |
| Previous Owner | Popowski Andrzej | $160,000 |
Source: Public Records
Tax History
| Year | Tax Paid | Tax Assessment Tax Assessment Total Assessment is a certain percentage of the fair market value that is determined by local assessors to be the total taxable value of land and additions on the property. | Land | Improvement |
|---|---|---|---|---|
| 2024 | $7,221 | $109,351 | $35,383 | $73,968 |
| 2023 | $6,696 | $101,120 | $32,720 | $68,400 |
| 2022 | $6,477 | $97,210 | $31,450 | $65,760 |
| 2021 | $6,286 | $94,790 | $30,670 | $64,120 |
| 2020 | $6,182 | $92,710 | $30,000 | $62,710 |
| 2019 | $5,817 | $88,140 | $28,520 | $59,620 |
| 2018 | $5,057 | $74,430 | $27,000 | $47,430 |
| 2017 | $4,952 | $70,930 | $25,730 | $45,200 |
| 2016 | $4,895 | $66,820 | $24,240 | $42,580 |
| 2015 | $4,817 | $62,250 | $22,580 | $39,670 |
| 2014 | $5,180 | $67,980 | $20,620 | $47,360 |
| 2013 | $5,135 | $68,940 | $20,910 | $48,030 |
Source: Public Records
Map
Nearby Homes
- 169 S Villa Ave
- 237 S Villa Ave
- 251 S Oakland Grove
- 58 E Division St
- 17W517 Manor Ln
- 235 N Ardmore Ave
- 395 S Scott St
- 215 S Sunnyside Ave
- 192 N Bonnie Brae Ave
- 327 N Princeton Ave Unit 9
- 232 S Oakland Ave
- 175 S Fairview Ave
- 204 E Hill St
- 528 N Ardmore Ave
- 108 S Cornell Ave
- 329 S Monterey Ave
- 469 S Sunnyside Ave
- 316 E Highland Ave
- 409 S Berkley Ave
- 421 S Berkley Ave
- 204 S Pick Ave
- 194 S Pick Ave
- 203 S Pick Ave
- 214 S Pick Ave
- 209 S Pick Ave
- 201 S Villa Ave
- 213 S Pick Ave
- 192 S Pick Ave
- 205 S Villa Ave
- 197 S Pick Ave
- 209 S Villa Ave
- 210 S Pick Ave
- 193 S Villa Ave
- 217 S Pick Ave
- 188 S Pick Ave
- 213 S Villa Ave
- 187 S Villa Ave
- 193 S Pick Ave
- 224 S Pick Ave
- 221 S Pick Ave
Your Personal Tour Guide
Ask me questions while you tour the home.