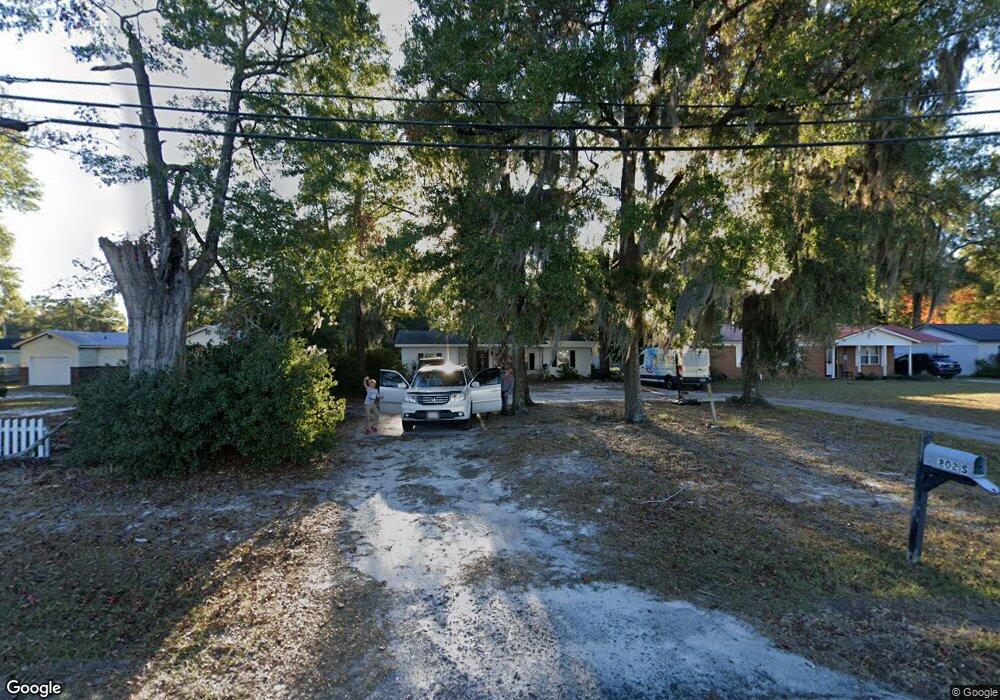
202 S Railroad Ave Unit 5 Springfield, GA 31329
Estimated Value: $229,000 - $563,000
3
Beds
2
Baths
1,669
Sq Ft
$195/Sq Ft
Est. Value
About This Home
This home is located at 202 S Railroad Ave Unit 5, Springfield, GA 31329 and is currently estimated at $325,566, approximately $195 per square foot. 202 S Railroad Ave Unit 5 is a home located in Effingham County with nearby schools including Springfield Elementary School, Effingham County Middle School, and Effingham County High School.
Ownership History
Date
Name
Owned For
Owner Type
Purchase Details
Closed on
Nov 9, 2015
Sold by
Sellars Brandon Marshall
Bought by
Wittkamp Velma Carolyn
Current Estimated Value
Home Financials for this Owner
Home Financials are based on the most recent Mortgage that was taken out on this home.
Original Mortgage
$93,750
Outstanding Balance
$73,714
Interest Rate
3.78%
Mortgage Type
New Conventional
Estimated Equity
$251,852
Purchase Details
Closed on
May 18, 2006
Sold by
Armstrong Craig S
Bought by
Sellars Brandon Marshall
Home Financials for this Owner
Home Financials are based on the most recent Mortgage that was taken out on this home.
Original Mortgage
$88,774
Interest Rate
6.44%
Mortgage Type
New Conventional
Purchase Details
Closed on
Sep 19, 2005
Sold by
Carter Darrell J
Bought by
Armstrong Craig S and Armstrong Harriette
Create a Home Valuation Report for This Property
The Home Valuation Report is an in-depth analysis detailing your home's value as well as a comparison with similar homes in the area
Home Values in the Area
Average Home Value in this Area
Purchase History
| Date | Buyer | Sale Price | Title Company |
|---|---|---|---|
| Wittkamp Velma Carolyn | $125,000 | -- | |
| Sellars Brandon Marshall | $87,000 | -- | |
| Armstrong Craig S | $50,000 | -- |
Source: Public Records
Mortgage History
| Date | Status | Borrower | Loan Amount |
|---|---|---|---|
| Open | Wittkamp Velma Carolyn | $93,750 | |
| Previous Owner | Sellars Brandon Marshall | $88,774 | |
| Closed | Armstrong Craig S | $0 |
Source: Public Records
Tax History Compared to Growth
Tax History
| Year | Tax Paid | Tax Assessment Tax Assessment Total Assessment is a certain percentage of the fair market value that is determined by local assessors to be the total taxable value of land and additions on the property. | Land | Improvement |
|---|---|---|---|---|
| 2024 | $2,900 | $69,245 | $8,976 | $60,269 |
| 2023 | $2,245 | $67,320 | $7,480 | $59,840 |
| 2022 | $2,210 | $60,973 | $6,120 | $54,853 |
| 2021 | $2,133 | $58,007 | $5,440 | $52,567 |
| 2020 | $1,828 | $51,787 | $5,440 | $46,347 |
| 2019 | $1,751 | $50,427 | $4,080 | $46,347 |
| 2018 | $1,626 | $46,612 | $4,080 | $42,532 |
| 2017 | $1,569 | $44,587 | $4,080 | $40,507 |
| 2016 | $1,565 | $45,011 | $4,760 | $40,251 |
| 2015 | -- | $42,023 | $4,400 | $37,623 |
| 2014 | -- | $45,223 | $7,600 | $37,623 |
| 2013 | -- | $46,423 | $8,800 | $37,623 |
Source: Public Records
Map
Nearby Homes
- 0 Zettler Rd
- 0 W Madison St
- 0 Georgia 119 Unit 317227
- 124 Old Stillwell Rd
- 110 Rose Dr
- 701 N Oak St
- 0 Hwy 21 N Unit 329376
- 0 Hwy 21 N Unit SA342214
- 0 Georgia 21 Unit B SA332004
- 0 Georgia 21 Unit C SA332005
- 110 Magnolia Dr
- 900 Laurel N
- 503 N Ash St
- 904 N Ash St
- 640 W 3rd St
- 118 Webb Dr
- 678 W 3rd St
- 545 Mccall Rd
- 213 Doe Cir
- 202 Stag Rd