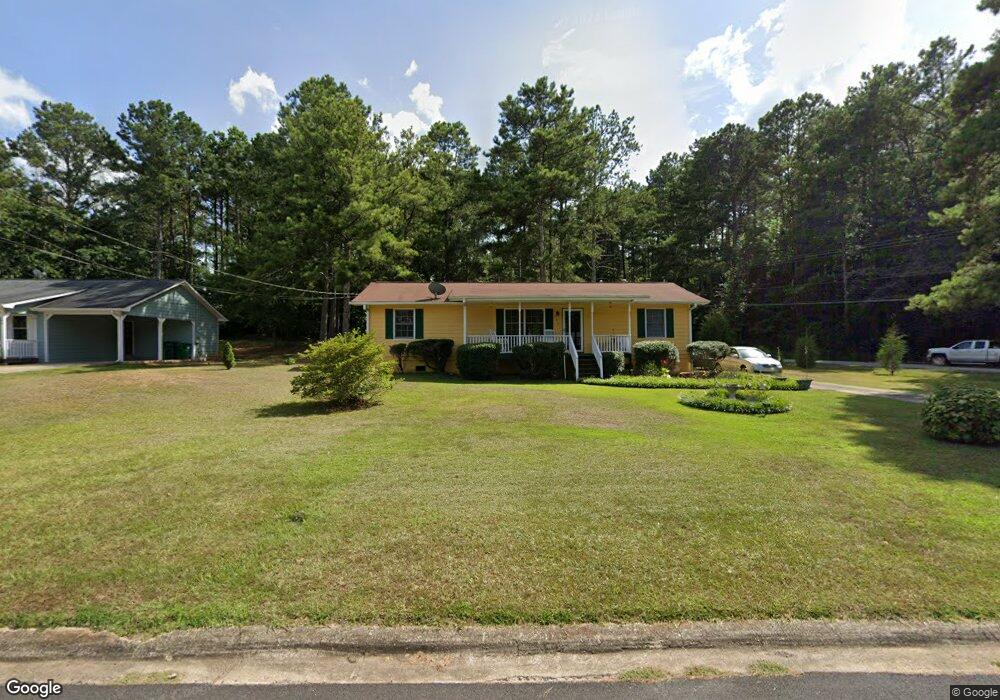
202 Sabal Dr Unit 2 Palmetto, GA 30268
Estimated Value: $200,000 - $234,000
2
Beds
2
Baths
1,500
Sq Ft
$148/Sq Ft
Est. Value
About This Home
This home is located at 202 Sabal Dr Unit 2, Palmetto, GA 30268 and is currently estimated at $222,258, approximately $148 per square foot. 202 Sabal Dr Unit 2 is a home located in Fulton County with nearby schools including Palmetto Elementary School, Bear Creek Middle School, and Creekside High School.
Ownership History
Date
Name
Owned For
Owner Type
Purchase Details
Closed on
Oct 7, 2002
Sold by
Bank Of America Na
Bought by
Thomas Morris C and Thomas Jackie E
Current Estimated Value
Home Financials for this Owner
Home Financials are based on the most recent Mortgage that was taken out on this home.
Original Mortgage
$90,000
Interest Rate
5.92%
Mortgage Type
New Conventional
Purchase Details
Closed on
Oct 2, 2001
Sold by
Russell Rodena E
Bought by
Bank Of America
Purchase Details
Closed on
Jul 20, 2000
Sold by
Leblanc Phillip J
Bought by
Russell Rodena E
Home Financials for this Owner
Home Financials are based on the most recent Mortgage that was taken out on this home.
Original Mortgage
$75,905
Interest Rate
8.23%
Mortgage Type
New Conventional
Purchase Details
Closed on
Jan 31, 1997
Sold by
Alexander Ricky E Albert
Bought by
Leblanc Phillip J
Create a Home Valuation Report for This Property
The Home Valuation Report is an in-depth analysis detailing your home's value as well as a comparison with similar homes in the area
Home Values in the Area
Average Home Value in this Area
Purchase History
| Date | Buyer | Sale Price | Title Company |
|---|---|---|---|
| Thomas Morris C | $90,000 | -- | |
| Bank Of America | $80,771 | -- | |
| Russell Rodena E | $79,900 | -- | |
| Leblanc Phillip J | $60,900 | -- |
Source: Public Records
Mortgage History
| Date | Status | Borrower | Loan Amount |
|---|---|---|---|
| Previous Owner | Thomas Morris C | $90,000 | |
| Previous Owner | Russell Rodena E | $75,905 | |
| Closed | Leblanc Phillip J | $0 |
Source: Public Records
Tax History Compared to Growth
Tax History
| Year | Tax Paid | Tax Assessment Tax Assessment Total Assessment is a certain percentage of the fair market value that is determined by local assessors to be the total taxable value of land and additions on the property. | Land | Improvement |
|---|---|---|---|---|
| 2025 | $647 | $75,480 | $17,240 | $58,240 |
| 2023 | $2,194 | $77,720 | $28,760 | $48,960 |
| 2022 | $1,000 | $38,000 | $9,680 | $28,320 |
| 2021 | $982 | $36,200 | $7,400 | $28,800 |
| 2020 | $994 | $35,760 | $7,320 | $28,440 |
| 2019 | $980 | $35,120 | $7,160 | $27,960 |
| 2018 | $968 | $34,280 | $7,000 | $27,280 |
| 2017 | $921 | $31,560 | $6,600 | $24,960 |
| 2016 | $943 | $32,320 | $9,520 | $22,800 |
| 2015 | $947 | $32,320 | $9,520 | $22,800 |
| 2014 | $625 | $20,400 | $6,000 | $14,400 |
Source: Public Records
Map
Nearby Homes
- 212 Greensprings Ct Unit 2
- 234 Fayetteville Rd
- 207 Morris St
- 0 Phipps Rd Unit 10559280
- 0 Phipps Rd
- 0 Phipps Rd Unit 7611236
- 594 Collinsworth Rd
- 211 Cobb St
- 534 Locke St
- 10904 Serenbe Ln
- 205 Cobb St
- 80 Menefee St
- 518 Toombs St
- 8393 Columbia Ct
- 8387 Columbia Ct
- 8395 Columbia Ct Unit LOT 3
- 8381 Columbia Ct
- 8373 Columbia Ct
- 8393 Columbia Ct Unit LOT 4
- 8383 Columbia Ct Unit LOT 7
- 204 Sabal Dr
- 215 Sabal Dr
- 206 Sabal Dr
- 208 Sabal Dr
- 203 Sabal Dr Unit 2
- 201 Sabal Dr Unit 2
- 210 Sabal Dr
- 207 Sabal Dr
- 205 Greensprings Dr
- 212 Sabal Dr
- 209 Sabal Dr Unit 2
- 220 Fond Ct Unit 1
- 207 Greensprings Dr Unit 2
- 219 Fond Ct
- 214 Sabal Dr
- 209 Greensprings Dr
- 211 Sabal Dr
- 202 Greensprings Dr
- 211 Greensprings Dr
- 218 Fond Ct