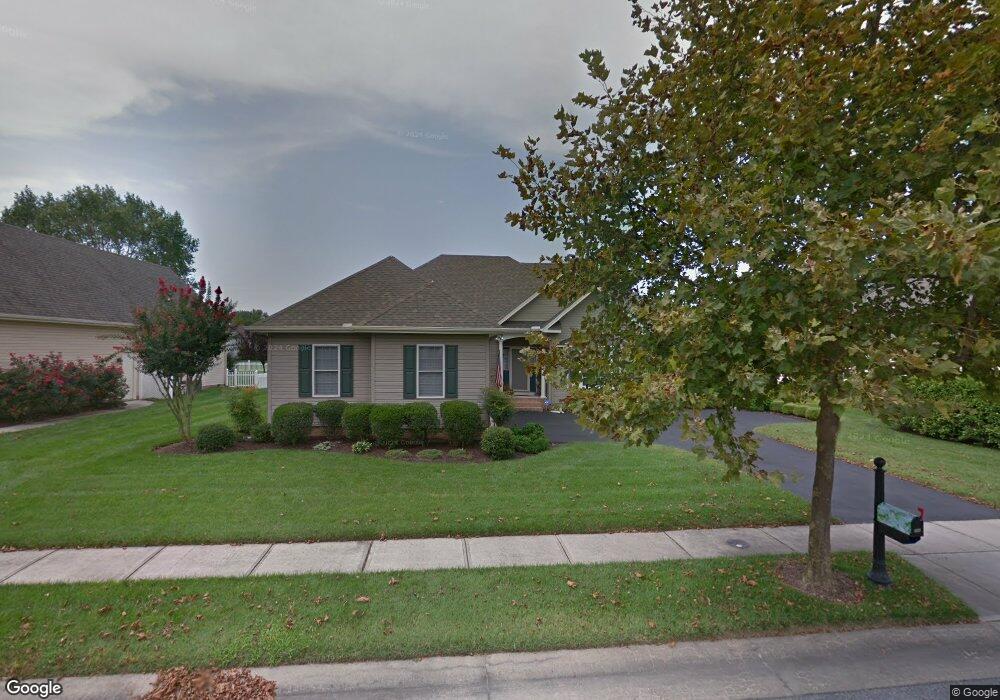
202 Sandy Bottom Ct Salisbury, MD 21804
South Salisbury NeighborhoodEstimated Value: $349,232 - $392,000
--
Bed
2
Baths
1,813
Sq Ft
$204/Sq Ft
Est. Value
About This Home
This home is located at 202 Sandy Bottom Ct, Salisbury, MD 21804 and is currently estimated at $369,808, approximately $203 per square foot. 202 Sandy Bottom Ct is a home located in Wicomico County with nearby schools including Fruitland Primary School, Fruitland Intermediate School, and Bennett Middle School.
Ownership History
Date
Name
Owned For
Owner Type
Purchase Details
Closed on
Mar 26, 2021
Sold by
Butler Sylvia M and Vestal Monique C
Bought by
Helmick Catherine Sue
Current Estimated Value
Home Financials for this Owner
Home Financials are based on the most recent Mortgage that was taken out on this home.
Original Mortgage
$256,500
Outstanding Balance
$231,215
Interest Rate
2.9%
Mortgage Type
New Conventional
Estimated Equity
$138,593
Purchase Details
Closed on
Mar 7, 2005
Sold by
Thomas H Ruark Inc
Bought by
Butler Sylvia M
Create a Home Valuation Report for This Property
The Home Valuation Report is an in-depth analysis detailing your home's value as well as a comparison with similar homes in the area
Home Values in the Area
Average Home Value in this Area
Purchase History
| Date | Buyer | Sale Price | Title Company |
|---|---|---|---|
| Helmick Catherine Sue | $285,000 | None Available | |
| Butler Sylvia M | $218,500 | -- |
Source: Public Records
Mortgage History
| Date | Status | Borrower | Loan Amount |
|---|---|---|---|
| Open | Helmick Catherine Sue | $256,500 |
Source: Public Records
Tax History Compared to Growth
Tax History
| Year | Tax Paid | Tax Assessment Tax Assessment Total Assessment is a certain percentage of the fair market value that is determined by local assessors to be the total taxable value of land and additions on the property. | Land | Improvement |
|---|---|---|---|---|
| 2025 | $2,504 | $281,100 | $0 | $0 |
| 2024 | $2,504 | $261,200 | $45,000 | $216,200 |
| 2023 | $2,530 | $255,900 | $0 | $0 |
| 2022 | $2,554 | $250,600 | $0 | $0 |
| 2021 | $2,508 | $245,300 | $45,000 | $200,300 |
| 2020 | $1,430 | $238,767 | $0 | $0 |
| 2019 | $2,431 | $232,233 | $0 | $0 |
| 2018 | $4,384 | $225,700 | $45,000 | $180,700 |
| 2017 | $2,950 | $212,500 | $0 | $0 |
| 2016 | -- | $199,300 | $0 | $0 |
| 2015 | $2,168 | $186,100 | $0 | $0 |
| 2014 | $2,168 | $186,100 | $0 | $0 |
Source: Public Records
Map
Nearby Homes
- 137 Village Oak Dr
- 116 Coulbourn Dr
- 187 Emily Dr
- 138 Coulbourn Dr
- 210 Hunter's Way
- 139 Coulbourn Dr
- 202 Hunter's Way
- 1504 Lilac Dr
- 225 Canal Park Dr Unit 15
- 1505 May Dr
- 202 Donegal Ct
- 207 Morris Dr
- 1410 Limrock Ct
- 209 Morris Dr
- 1500 Laurel Dr
- 415 Creekside Trail
- 224 Canal Park Dr Unit 101
- 231 Canal Park Dr Unit A200
- 228 Canal Park Dr Unit G7
- 228 Canal Park Dr Unit G106
- 204 Sandy Bottom Ct
- 200 Sandy Bottom Ct
- 205 Sandy Bottom Ct
- 206 Sandy Bottom Ct
- 204 Creekside Dr
- 202 Creekside Dr
- 201 Sandy Bottom Ct
- 207 Sandy Bottom Ct
- 200 Creekside Dr
- 208 Sandy Bottom Ct
- 209 Sandy Bottom Ct
- 206 Creekside Dr
- 107 Village Oak Dr
- 105 Village Oak Dr
- 115 Village Oak Dr
- 113 Village Oak Dr
- 201 Creekside Dr
- 203 Creekside Dr
- 211 Sandy Bottom Ct
- 101 Village Oak Dr