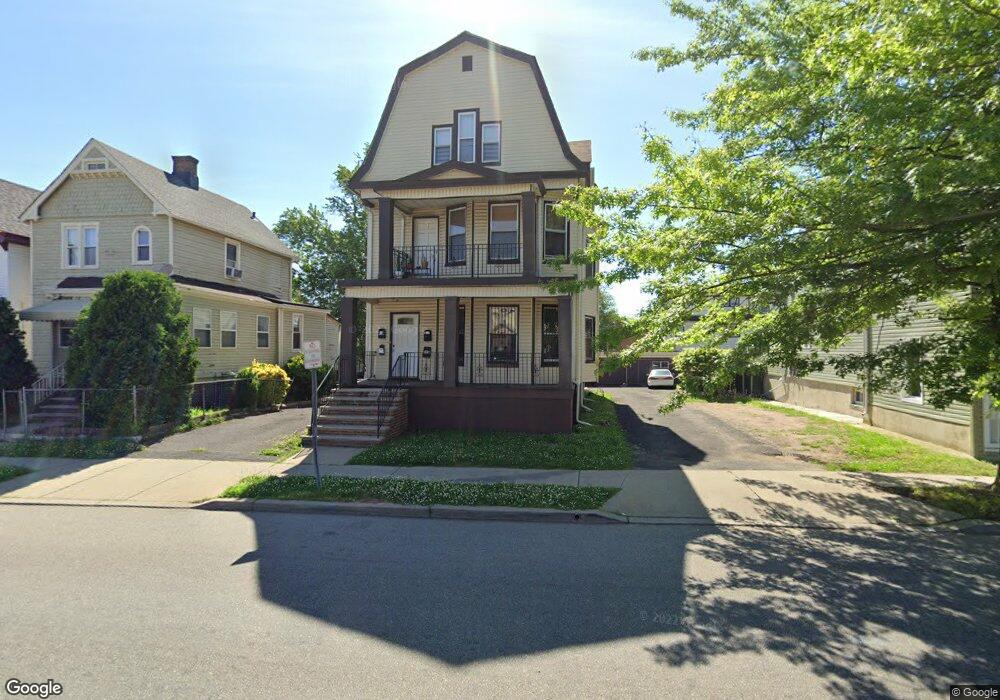
202 Sanford St East Orange, NJ 07018
Estimated Value: $448,000 - $824,000
--
Bed
--
Bath
4,588
Sq Ft
$151/Sq Ft
Est. Value
About This Home
This home is located at 202 Sanford St, East Orange, NJ 07018 and is currently estimated at $692,534, approximately $150 per square foot. 202 Sanford St is a home located in Essex County with nearby schools including Benjamin Banneker Academy, John L Costley Middle School, and Patrick F Healy Middle School.
Ownership History
Date
Name
Owned For
Owner Type
Purchase Details
Closed on
Sep 29, 2016
Sold by
Wray Llewellyn
Bought by
Wray Estella and Lawrence Barrington
Current Estimated Value
Purchase Details
Closed on
Nov 4, 2015
Sold by
Lawrence Barrington
Bought by
Lawrence Barrington and Wray Estella
Home Financials for this Owner
Home Financials are based on the most recent Mortgage that was taken out on this home.
Interest Rate
3.76%
Purchase Details
Closed on
May 16, 2011
Sold by
Wray Estella
Bought by
Lawrence Barrington
Purchase Details
Closed on
Oct 13, 2005
Sold by
Osterhoudt Harry
Bought by
Wray Estella
Home Financials for this Owner
Home Financials are based on the most recent Mortgage that was taken out on this home.
Original Mortgage
$247,500
Interest Rate
9.5%
Mortgage Type
Adjustable Rate Mortgage/ARM
Create a Home Valuation Report for This Property
The Home Valuation Report is an in-depth analysis detailing your home's value as well as a comparison with similar homes in the area
Home Values in the Area
Average Home Value in this Area
Purchase History
| Date | Buyer | Sale Price | Title Company |
|---|---|---|---|
| Wray Estella | -- | None Available | |
| Wray Llwelyn | -- | None Available | |
| Lawrence Barrington | -- | -- | |
| Lawrence Barrington | -- | None Available | |
| Wray Estella | $275,000 | -- |
Source: Public Records
Mortgage History
| Date | Status | Borrower | Loan Amount |
|---|---|---|---|
| Previous Owner | Lawrence Barrington | -- | |
| Previous Owner | Wray Estella | $247,500 |
Source: Public Records
Tax History Compared to Growth
Tax History
| Year | Tax Paid | Tax Assessment Tax Assessment Total Assessment is a certain percentage of the fair market value that is determined by local assessors to be the total taxable value of land and additions on the property. | Land | Improvement |
|---|---|---|---|---|
| 2025 | $13,290 | $419,500 | $85,100 | $334,400 |
| 2024 | $13,290 | $419,500 | $85,100 | $334,400 |
| 2022 | $12,191 | $419,500 | $85,100 | $334,400 |
| 2021 | $12,899 | $232,800 | $46,500 | $186,300 |
| 2020 | $12,734 | $232,800 | $46,500 | $186,300 |
| 2019 | $12,571 | $232,800 | $46,500 | $186,300 |
| 2018 | $12,415 | $232,800 | $46,500 | $186,300 |
| 2017 | $12,068 | $232,800 | $46,500 | $186,300 |
| 2016 | $11,880 | $232,800 | $46,500 | $186,300 |
| 2015 | $11,589 | $232,800 | $46,500 | $186,300 |
| 2014 | $11,426 | $232,800 | $46,500 | $186,300 |
Source: Public Records
Map
Nearby Homes
- 312 Rhode Island Ave
- 95 Crawford St
- 38 Telford St
- 344 Elmwood Ave
- 49 Edgar St
- 374 Halsted St Unit 2
- 374 Halsted St
- 233 Rhode Island Ave
- 434 Halsted St Unit 8
- 116 Sanford St
- 375 Amherst St
- 72 Elliot Place
- 207 Tremont Ave
- 318 Amherst St
- 328 Halsted St
- 94 Sanford St
- 288 Amherst St Unit 3
- 288 Amherst St
- 6 Emerson St
- 206 Sanford St
- 200 Sanford St
- 208 Sanford St
- 198 Sanford St
- 194 Sanford St Unit 1
- 194 Sanford St
- 35 Bedford St
- 45 Bedford St
- 31 Bedford St
- 319 Rhode Island Ave
- 182 Sanford St
- 182 Sanford St Unit 2
- 180 Sanford St
- 213 Sanford St Unit 999
- 213 Sanford St
- 213 Sanford St Unit 1
- 27 Bedford St
- 224 Sanford St
- 309 Rhode Island Ave Unit 311
- 308 308 Halsted St