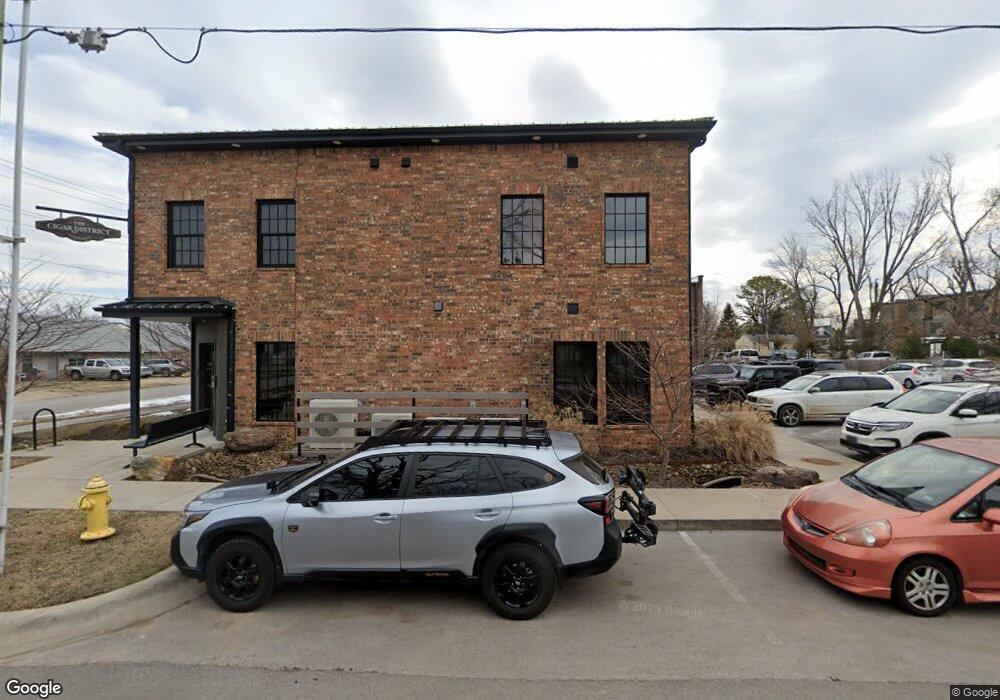
202 SE 6th St Bentonville, AR 72712
Estimated Value: $706,000
--
Bed
1
Bath
9,512
Sq Ft
$74/Sq Ft
Est. Value
About This Home
This home is located at 202 SE 6th St, Bentonville, AR 72712 and is currently priced at $706,000, approximately $74 per square foot. 202 SE 6th St is a home located in Benton County with nearby schools including R.E. Baker Elementary School, Old High Middle School, and Washington Junior High School.
Ownership History
Date
Name
Owned For
Owner Type
Purchase Details
Closed on
Jul 8, 2016
Sold by
Brown Bradley
Bought by
Masching Rebecca H
Current Estimated Value
Home Financials for this Owner
Home Financials are based on the most recent Mortgage that was taken out on this home.
Original Mortgage
$200,000
Outstanding Balance
$164,222
Interest Rate
4.5%
Mortgage Type
Adjustable Rate Mortgage/ARM
Purchase Details
Closed on
Sep 19, 2014
Sold by
Brown Bradley
Bought by
Brown Bradley
Purchase Details
Closed on
Jun 27, 2001
Bought by
Dod 06-27-2001
Purchase Details
Closed on
Jun 10, 1994
Bought by
Snook
Purchase Details
Closed on
Feb 18, 1994
Bought by
Witcher Inv
Purchase Details
Closed on
Dec 21, 1992
Bought by
Rubin
Purchase Details
Closed on
Dec 4, 1992
Bought by
Donald F Rubin Inc
Purchase Details
Closed on
Mar 9, 1981
Bought by
Classic Homes Investors Inc
Create a Home Valuation Report for This Property
The Home Valuation Report is an in-depth analysis detailing your home's value as well as a comparison with similar homes in the area
Home Values in the Area
Average Home Value in this Area
Purchase History
| Date | Buyer | Sale Price | Title Company |
|---|---|---|---|
| Masching Rebecca H | $238,000 | Mercury Title Llc | |
| Brown Bradley | -- | None Available | |
| Dod 06-27-2001 | -- | -- | |
| Snook | $39,000 | -- | |
| Witcher | -- | -- | |
| Witcher Inv | $20,000 | -- | |
| Witcher Inv | -- | -- | |
| Rubin | -- | -- | |
| Lake Crescent | -- | -- | |
| Donald F Rubin Inc | -- | -- | |
| Lake Crescent Deve | -- | -- | |
| Classic Homes Investors Inc | $20,000 | -- |
Source: Public Records
Mortgage History
| Date | Status | Borrower | Loan Amount |
|---|---|---|---|
| Open | Masching Rebecca H | $200,000 |
Source: Public Records
Tax History Compared to Growth
Tax History
| Year | Tax Paid | Tax Assessment Tax Assessment Total Assessment is a certain percentage of the fair market value that is determined by local assessors to be the total taxable value of land and additions on the property. | Land | Improvement |
|---|---|---|---|---|
| 2025 | $21,020 | $341,681 | $152,892 | $188,789 |
| 2024 | $21,116 | $341,681 | $152,892 | $188,789 |
| 2023 | $20,657 | $334,248 | $137,603 | $196,645 |
| 2022 | $21,158 | $334,248 | $137,603 | $196,645 |
| 2021 | $4,662 | $73,900 | $73,900 | $0 |
| 2020 | $2,922 | $45,870 | $45,870 | $0 |
| 2019 | $3,220 | $50,550 | $45,870 | $4,680 |
| 2018 | $3,220 | $50,550 | $45,870 | $4,680 |
| 2017 | $596 | $50,550 | $45,870 | $4,680 |
| 2016 | $596 | $50,550 | $45,870 | $4,680 |
| 2015 | $553 | $14,610 | $4,000 | $10,610 |
| 2014 | $391 | $14,610 | $4,000 | $10,610 |
Source: Public Records
Map
Nearby Homes
- 202 SE 6th St Unit 101
- 202 SE 6th St Unit 102
- 204 SE 6th St
- 204 SE 6th St Unit 101
- 204 SE 6th St Unit 102
- 206 SE 6th St
- 206 SE 6th St Unit 2
- 206 SE 6th St Unit 1
- 203 6th St
- 203 6th St Unit A
- 604 SE B St
- 208 SE 6th St
- 108 SE 6th St
- 203 SE 7th St
- 606 SE B St
- 201 SE 7th St
- 604 SE A St
- 209 SE 6th St Unit B
- 209 SE 6th St Unit A
- 507 SE A St Unit B