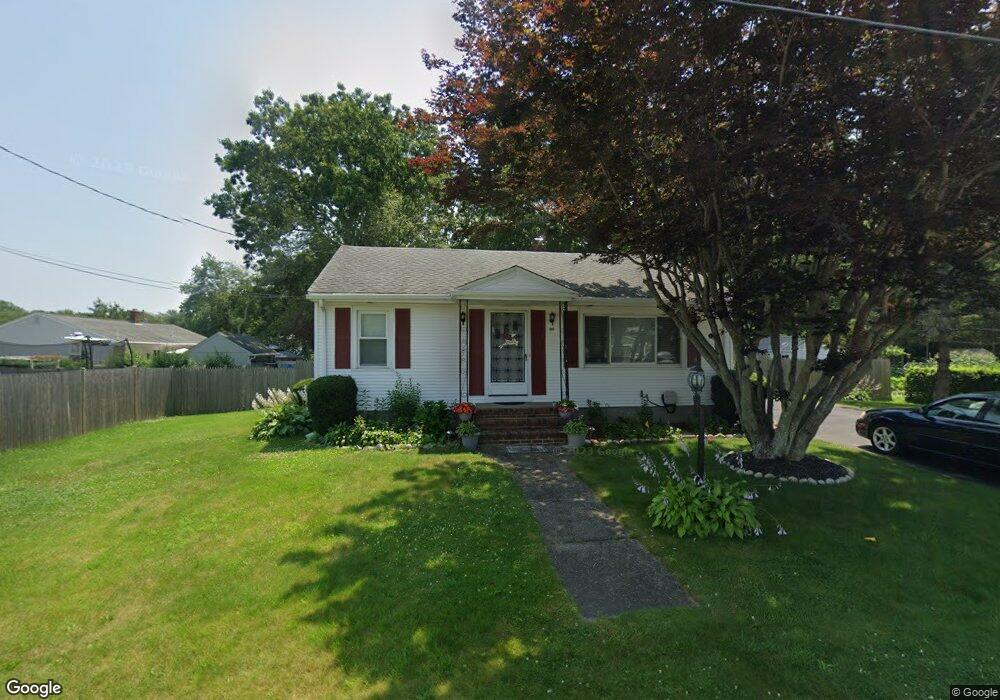
202 Sharp St North Dartmouth, MA 02747
Bliss Corner NeighborhoodEstimated Value: $427,000 - $444,215
2
Beds
1
Bath
884
Sq Ft
$493/Sq Ft
Est. Value
About This Home
This home is located at 202 Sharp St, North Dartmouth, MA 02747 and is currently estimated at $436,054, approximately $493 per square foot. 202 Sharp St is a home located in Bristol County with nearby schools including Dartmouth High School, Our Sister's School, and Bishop Stang High School.
Ownership History
Date
Name
Owned For
Owner Type
Purchase Details
Closed on
Feb 2, 2018
Sold by
Fernandes-Dafonseca C V
Bought by
Fonseca Fernandes-Dafonseca C and Fonseca Anabela
Current Estimated Value
Purchase Details
Closed on
Nov 22, 2017
Sold by
Celeste Ribeiro Nt
Bought by
Fernandes-Dafonseca C V
Home Financials for this Owner
Home Financials are based on the most recent Mortgage that was taken out on this home.
Original Mortgage
$198,850
Interest Rate
3.91%
Mortgage Type
New Conventional
Create a Home Valuation Report for This Property
The Home Valuation Report is an in-depth analysis detailing your home's value as well as a comparison with similar homes in the area
Home Values in the Area
Average Home Value in this Area
Purchase History
| Date | Buyer | Sale Price | Title Company |
|---|---|---|---|
| Fonseca Fernandes-Dafonseca C | -- | -- | |
| Fernandes-Dafonseca C V | -- | -- |
Source: Public Records
Mortgage History
| Date | Status | Borrower | Loan Amount |
|---|---|---|---|
| Previous Owner | Fernandes-Dafonseca C V | $198,850 |
Source: Public Records
Tax History Compared to Growth
Tax History
| Year | Tax Paid | Tax Assessment Tax Assessment Total Assessment is a certain percentage of the fair market value that is determined by local assessors to be the total taxable value of land and additions on the property. | Land | Improvement |
|---|---|---|---|---|
| 2025 | $2,731 | $317,200 | $158,600 | $158,600 |
| 2024 | $2,630 | $302,600 | $151,300 | $151,300 |
| 2023 | $2,541 | $277,100 | $140,300 | $136,800 |
| 2022 | $2,457 | $248,200 | $134,200 | $114,000 |
| 2021 | $2,306 | $222,600 | $118,400 | $104,200 |
| 2020 | $2,263 | $218,000 | $118,400 | $99,600 |
| 2019 | $2,255 | $216,800 | $118,400 | $98,400 |
| 2018 | $2,198 | $205,700 | $118,400 | $87,300 |
| 2017 | $1,979 | $197,500 | $111,700 | $85,800 |
| 2016 | $1,954 | $192,300 | $111,700 | $80,600 |
| 2015 | $1,887 | $186,100 | $104,400 | $81,700 |
| 2014 | $1,784 | $174,700 | $94,700 | $80,000 |
Source: Public Records
Map
Nearby Homes