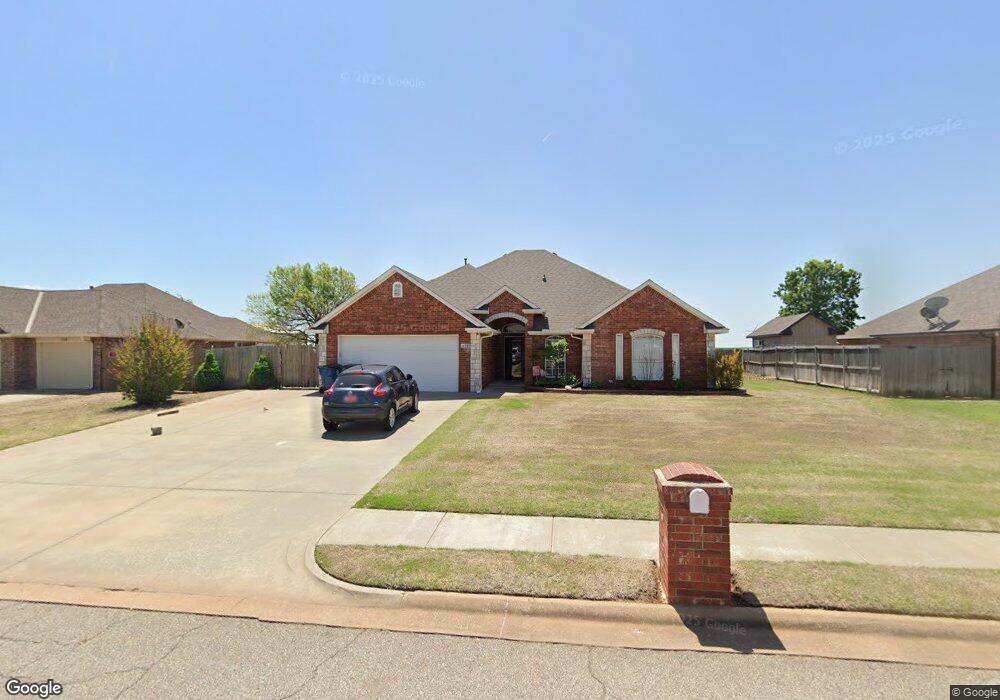
202 Southpointe Ave Tuttle, OK 73089
Estimated Value: $283,979 - $306,000
3
Beds
2
Baths
1,902
Sq Ft
$156/Sq Ft
Est. Value
About This Home
This home is located at 202 Southpointe Ave, Tuttle, OK 73089 and is currently estimated at $297,245, approximately $156 per square foot. 202 Southpointe Ave is a home located in Grady County with nearby schools including Tuttle Intermediate School, Tuttle Elementary School, and Tuttle Middle School.
Ownership History
Date
Name
Owned For
Owner Type
Purchase Details
Closed on
Nov 21, 2006
Sold by
Allred Construction Llc
Bought by
Peery Bobbie
Current Estimated Value
Home Financials for this Owner
Home Financials are based on the most recent Mortgage that was taken out on this home.
Original Mortgage
$185,000
Outstanding Balance
$110,088
Interest Rate
6.41%
Mortgage Type
New Conventional
Estimated Equity
$187,157
Purchase Details
Closed on
Jun 13, 2006
Sold by
Southpointe Land Co Llc
Bought by
Allred Construction Lcl and Allred Construction Llc
Home Financials for this Owner
Home Financials are based on the most recent Mortgage that was taken out on this home.
Original Mortgage
$143,000
Interest Rate
6.67%
Mortgage Type
Construction
Create a Home Valuation Report for This Property
The Home Valuation Report is an in-depth analysis detailing your home's value as well as a comparison with similar homes in the area
Home Values in the Area
Average Home Value in this Area
Purchase History
| Date | Buyer | Sale Price | Title Company |
|---|---|---|---|
| Peery Bobbie | $185,000 | None Available | |
| Allred Construction Lcl | $21,500 | None Available |
Source: Public Records
Mortgage History
| Date | Status | Borrower | Loan Amount |
|---|---|---|---|
| Open | Peery Bobbie | $185,000 | |
| Previous Owner | Allred Construction Lcl | $143,000 |
Source: Public Records
Tax History
| Year | Tax Paid | Tax Assessment Tax Assessment Total Assessment is a certain percentage of the fair market value that is determined by local assessors to be the total taxable value of land and additions on the property. | Land | Improvement |
|---|---|---|---|---|
| 2025 | $2,677 | $26,671 | $3,078 | $23,593 |
| 2024 | $2,793 | $25,894 | $2,988 | $22,906 |
| 2023 | $2,793 | $25,140 | $2,903 | $22,237 |
| 2022 | $2,521 | $24,289 | $3,372 | $20,917 |
| 2021 | $2,446 | $23,580 | $3,409 | $20,171 |
| 2020 | $2,393 | $22,894 | $2,945 | $19,949 |
| 2019 | $2,324 | $22,227 | $2,209 | $20,018 |
| 2018 | $2,128 | $21,579 | $2,111 | $19,468 |
| 2017 | $2,117 | $20,951 | $2,553 | $18,398 |
| 2016 | $2,090 | $20,342 | $2,681 | $17,661 |
| 2015 | $1,982 | $20,342 | $2,681 | $17,661 |
| 2014 | $1,982 | $20,350 | $2,365 | $17,985 |
Source: Public Records
Map
Nearby Homes
- 605 SW 4th St
- 502 SW 5th St
- 104 SE 2nd St
- 2 NW 6th St
- 516 Kings Ct
- 10 Westend Ct
- 1 NW 7th St
- 309 Elm St
- 311 N Cimarron Rd
- 106 Englebretson Ln
- 2025 E Rock Creek Rd
- 1301 E Rock Creek Rd
- 1260 E Rock Creek Rd
- 901 N Cimarron Rd
- 903 County Street 2910
- 1874 E Rock Creek Rd
- 601 S Frisco Rd
- 1636 Big Sky Dr
- 1628 Big Sky Dr
- 973 Hadley Ln
- 204 Southpointe Ave
- 108 Southpointe Ave
- 206 Southpointe Ave
- 106 Southpointe Ave
- 208 Southpointe Ave
- 205 Southpointe Ave
- 203 Southpointe Ave
- 107 Southpointe Ave
- 105 Southpointe Ave
- 802 SW 3rd St
- 300 Southpointe Ave
- 103 Southpointe Ave
- 102 Southpointe Ave
- 302 Silver Leaf Place
- 803 SW 3rd St
- 10 Southpointe Ave
- 101 Southpointe Ave
- 305 Silver Leaf Place
- 304 Silver Leaf Place
- 303 Golden Terrace
Your Personal Tour Guide
Ask me questions while you tour the home.