
Landlord's Agent in 2023
Toni Hardigree
Platinum Properties
(912) 596-3678
2 in this area
164 Total Sales
Estimated Value: $314,338 - $345,000
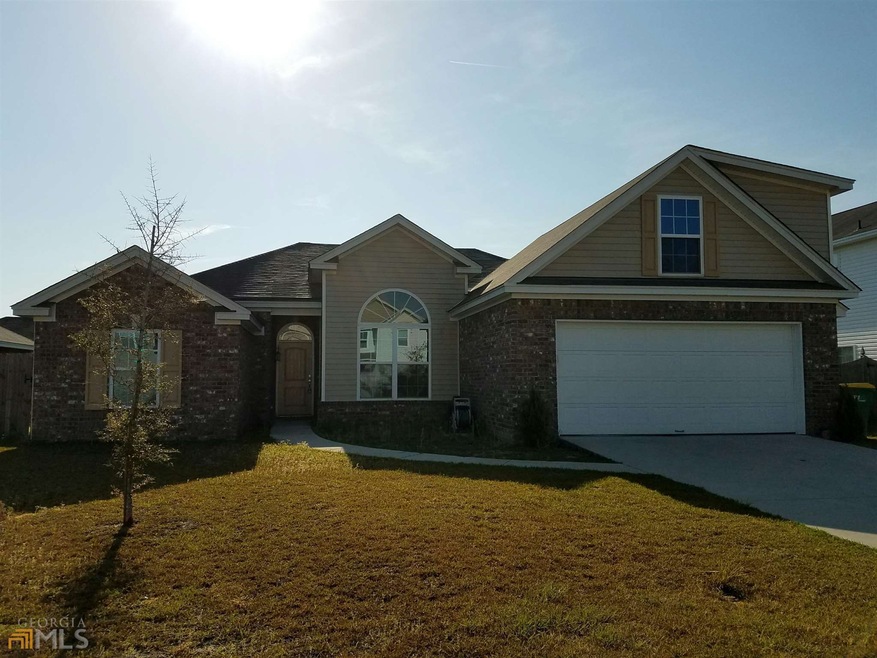
Split plan 4 bedroom, 2 bath with attached front entry two car garage. 4th bedroom is located upstairs. Foyer entry. Living room and formal dining has wood laminate flooring. Carpet in all downstairs bedrooms. Kitchen has granite countertops with stainless steel appliances. Breakfast area for table. Separate laundry room with washer/dryer hookups. Back yard is privacy fenced in. Pets not allowed.
Last Agent to Rent the Property
Platinum Properties License #312084 Listed on: 03/06/2023
| Date | Buyer | Sale Price | Title Company |
|---|---|---|---|
| Semper James Norman | -- | -- | |
| Semper James N | $187,311 | -- | |
| J K Homes Inc | $36,500 | -- | |
| Morgan Pines Development Co In | -- | -- | |
| Morgan Pines Development Co In | $1,219,000 | -- |
| Date | Status | Borrower | Loan Amount |
|---|---|---|---|
| Previous Owner | Semper James N | $191,338 |
| Date | Event | Price | List to Sale | Price per Sq Ft |
|---|---|---|---|---|
| 03/08/2023 03/08/23 | Rented | $2,300 | 0.0% | -- |
| 03/06/2023 03/06/23 | For Rent | $2,300 | +43.8% | -- |
| 03/12/2021 03/12/21 | Rented | $1,600 | 0.0% | -- |
| 02/10/2021 02/10/21 | Under Contract | -- | -- | -- |
| 02/01/2021 02/01/21 | For Rent | $1,600 | -- | -- |
| Year | Tax Paid | Tax Assessment Tax Assessment Total Assessment is a certain percentage of the fair market value that is determined by local assessors to be the total taxable value of land and additions on the property. | Land | Improvement |
|---|---|---|---|---|
| 2025 | $4,377 | $123,680 | $18,000 | $105,680 |
| 2024 | $34 | $122,640 | $18,000 | $104,640 |
| 2023 | $3,418 | $107,040 | $14,600 | $92,440 |
| 2022 | $2,935 | $98,120 | $14,600 | $83,520 |
| 2021 | $2,982 | $85,640 | $14,600 | $71,040 |
| 2020 | $2,606 | $83,400 | $14,600 | $68,800 |
| 2019 | $2,606 | $76,240 | $14,600 | $61,640 |
| 2018 | $2,526 | $73,800 | $14,600 | $59,200 |
| 2017 | $2,374 | $74,120 | $14,600 | $59,520 |
| 2016 | $2,356 | $73,440 | $14,600 | $58,840 |
| 2015 | $2,127 | $65,960 | $14,600 | $51,360 |
| 2014 | $2,275 | $66,680 | $0 | $0 |
Landlord's Agent in 2023
Toni Hardigree
Platinum Properties
(912) 596-3678
2 in this area
164 Total Sales
Source: Georgia MLS
MLS Number: 20107545
APN: 51011E10003
Disclaimer: Certain information contained herein is derived from information provided by parties other than Homes.com. All information provided is deemed reliable, but is not guaranteed to be accurate and should be independently verified.
![]() The data relating to real estate for sale on this web site comes in part from the Broker Reciprocity Program of Georgia MLS. Real estate listings held by brokerage firms other than Redfin are marked with the Broker Reciprocity logo and detailed information about them includes the name of the listing brokers. Information deemed reliable but not guaranteed. Copyright 2026 Georgia MLS. All rights reserved.
The data relating to real estate for sale on this web site comes in part from the Broker Reciprocity Program of Georgia MLS. Real estate listings held by brokerage firms other than Redfin are marked with the Broker Reciprocity logo and detailed information about them includes the name of the listing brokers. Information deemed reliable but not guaranteed. Copyright 2026 Georgia MLS. All rights reserved.
Ask me questions while you tour the home.