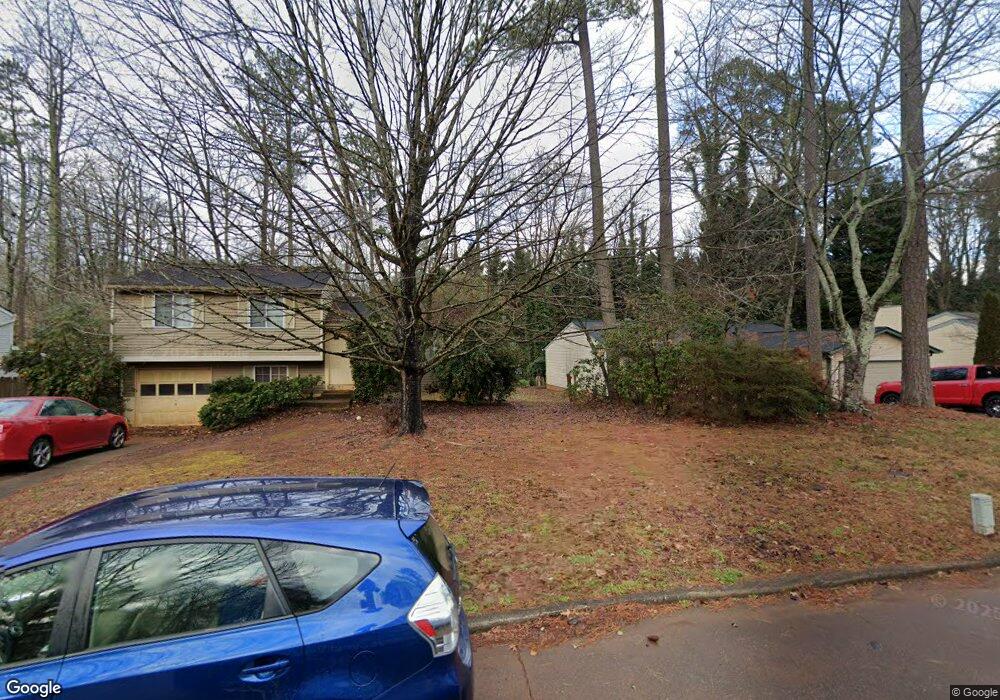
202 Streamside Dr Roswell, GA 30076
Estimated Value: $251,000 - $281,000
2
Beds
2
Baths
1,249
Sq Ft
$215/Sq Ft
Est. Value
About This Home
This home is located at 202 Streamside Dr, Roswell, GA 30076 and is currently estimated at $268,649, approximately $215 per square foot. 202 Streamside Dr is a home located in Fulton County with nearby schools including Hembree Springs Elementary School, Elkins Pointe Middle School, and Milton High School.
Ownership History
Date
Name
Owned For
Owner Type
Purchase Details
Closed on
Aug 18, 2017
Sold by
Smith Richard L
Bought by
Bahler Kelly Mary
Current Estimated Value
Purchase Details
Closed on
Nov 30, 2004
Sold by
Cendant Mobility Govt Finl Svc
Bought by
Smith Richard L
Home Financials for this Owner
Home Financials are based on the most recent Mortgage that was taken out on this home.
Original Mortgage
$91,200
Interest Rate
5.57%
Mortgage Type
New Conventional
Purchase Details
Closed on
Jul 2, 2001
Sold by
St Mary'S Coptic Orthodox Church
Bought by
Smith Philip D
Home Financials for this Owner
Home Financials are based on the most recent Mortgage that was taken out on this home.
Original Mortgage
$116,497
Interest Rate
7.16%
Mortgage Type
FHA
Purchase Details
Closed on
Jun 27, 1997
Sold by
Hembree Creek Associates Llc
Bought by
St Marys Coptic Orthodox Church Inc
Create a Home Valuation Report for This Property
The Home Valuation Report is an in-depth analysis detailing your home's value as well as a comparison with similar homes in the area
Home Values in the Area
Average Home Value in this Area
Purchase History
| Date | Buyer | Sale Price | Title Company |
|---|---|---|---|
| Bahler Kelly Mary | $121,000 | -- | |
| Smith Richard L | $114,000 | -- | |
| Cendant Mobility Govt Finl Svc | $116,500 | -- | |
| Smith Philip D | $120,100 | -- | |
| St Marys Coptic Orthodox Church Inc | $91,900 | -- |
Source: Public Records
Mortgage History
| Date | Status | Borrower | Loan Amount |
|---|---|---|---|
| Previous Owner | Cendant Mobility Govt Finl Svc | $91,200 | |
| Previous Owner | Smith Philip D | $116,497 |
Source: Public Records
Tax History
| Year | Tax Paid | Tax Assessment Tax Assessment Total Assessment is a certain percentage of the fair market value that is determined by local assessors to be the total taxable value of land and additions on the property. | Land | Improvement |
|---|---|---|---|---|
| 2025 | $387 | $96,240 | $14,320 | $81,920 |
| 2023 | $387 | $96,240 | $14,320 | $81,920 |
| 2022 | $2,129 | $80,920 | $10,440 | $70,480 |
| 2021 | $2,150 | $67,520 | $8,800 | $58,720 |
| 2020 | $2,079 | $63,480 | $8,280 | $55,200 |
| 2019 | $309 | $62,360 | $8,120 | $54,240 |
| 2018 | $1,366 | $48,400 | $7,240 | $41,160 |
| 2017 | $802 | $39,440 | $8,920 | $30,520 |
| 2016 | $801 | $39,440 | $8,920 | $30,520 |
| 2015 | $1,019 | $39,440 | $8,920 | $30,520 |
| 2014 | $510 | $29,000 | $6,560 | $22,440 |
Source: Public Records
Map
Nearby Homes
- 205 Streamside Dr
- 322 Streamside Dr
- 630 Streamside Dr
- 225 Arbor Creek Way
- 11505 Elkins Rd
- 1110 Upper Hembree Rd
- 785 E Hembree Crossing
- 555 Hembree Grove Overlook
- 1216 Harris Commons Place
- 1238 Harris Commons Place Unit 18
- 229 Dennis Dr
- 1374 Bellsmith Dr
- 245 E Creek Cir
- 135 Hembree Grove Ct
- 11205 Alpharetta Hwy Unit A2
- 993 Southerby Ln
- 110 North Bluff
- 300 Saddle Creek Ln
- 118 Harlow Cir
- 20058 Windalier Way
- 224 Streamside Dr Unit 224
- 224 Streamside Dr
- 224 Streamside Dr
- 214 Streamside Dr Unit 214
- 212 Streamside Dr
- 227 Streamside Dr Unit 227
- 205 Streamside Dr Unit 205
- 222 Streamside Dr
- 216 Streamside Dr
- 217 Streamside Dr Unit 217
- 215 Streamside Dr
- 213 Streamside Dr Unit 213
- 223 Streamside Dr
- 223 Streamside Dr Unit 223
- 201 Streamside Dr
- 225 Streamside Dr Unit 225
- 211 Streamside Dr
- 221 Streamside Dr Unit 221
- 206 Streamside Dr
- 228 Streamside Dr Unit 228
Your Personal Tour Guide
Ask me questions while you tour the home.