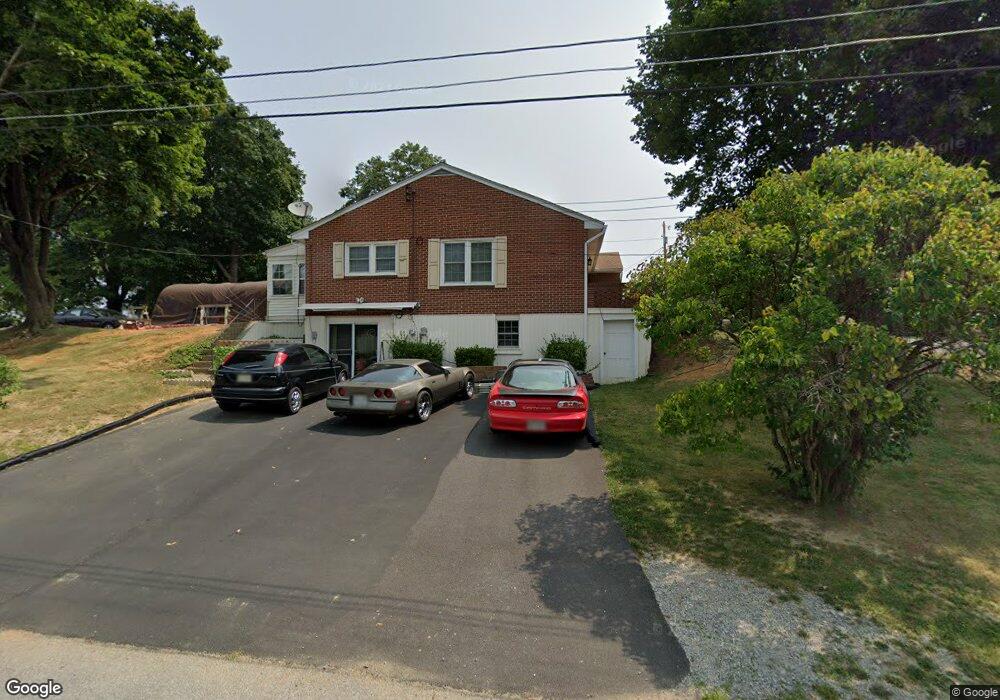
202 Surrey Rd Staunton, VA 24401
Estimated Value: $280,000 - $313,000
4
Beds
2
Baths
1,350
Sq Ft
$225/Sq Ft
Est. Value
About This Home
This home is located at 202 Surrey Rd, Staunton, VA 24401 and is currently estimated at $303,392, approximately $224 per square foot. 202 Surrey Rd is a home located in Staunton City with nearby schools including Ware Elementary School, Shelburne Middle School, and Staunton High School.
Ownership History
Date
Name
Owned For
Owner Type
Purchase Details
Closed on
Jan 1, 2010
Sold by
Marshall Vincent Randall and Estate Of Gloria S Marshall
Bought by
Beach Jeffrey H
Current Estimated Value
Home Financials for this Owner
Home Financials are based on the most recent Mortgage that was taken out on this home.
Original Mortgage
$152,192
Outstanding Balance
$99,516
Interest Rate
4.87%
Mortgage Type
FHA
Estimated Equity
$203,876
Create a Home Valuation Report for This Property
The Home Valuation Report is an in-depth analysis detailing your home's value as well as a comparison with similar homes in the area
Purchase History
| Date | Buyer | Sale Price | Title Company |
|---|---|---|---|
| Beach Jeffrey H | $155,000 | None Available |
Source: Public Records
Mortgage History
| Date | Status | Borrower | Loan Amount |
|---|---|---|---|
| Open | Beach Jeffrey H | $152,192 |
Source: Public Records
Tax History
| Year | Tax Paid | Tax Assessment Tax Assessment Total Assessment is a certain percentage of the fair market value that is determined by local assessors to be the total taxable value of land and additions on the property. | Land | Improvement |
|---|---|---|---|---|
| 2025 | $2,671 | $293,510 | $57,210 | $236,300 |
| 2024 | $2,237 | $251,350 | $50,350 | $201,000 |
| 2023 | $2,237 | $251,350 | $50,350 | $201,000 |
| 2022 | $1,759 | $191,190 | $36,890 | $154,300 |
| 2021 | $1,759 | $191,190 | $36,890 | $154,300 |
| 2020 | $1,617 | $170,190 | $36,890 | $133,300 |
| 2019 | $1,617 | $170,190 | $36,890 | $133,300 |
| 2018 | $1,511 | $155,790 | $36,890 | $118,900 |
| 2017 | $1,511 | $155,790 | $36,890 | $118,900 |
| 2016 | $1,444 | $151,990 | $36,890 | $115,100 |
| 2015 | $1,444 | $151,990 | $36,890 | $115,100 |
| 2014 | $1,444 | $151,990 | $36,890 | $115,100 |
Source: Public Records
Map
Nearby Homes
Your Personal Tour Guide
Ask me questions while you tour the home.