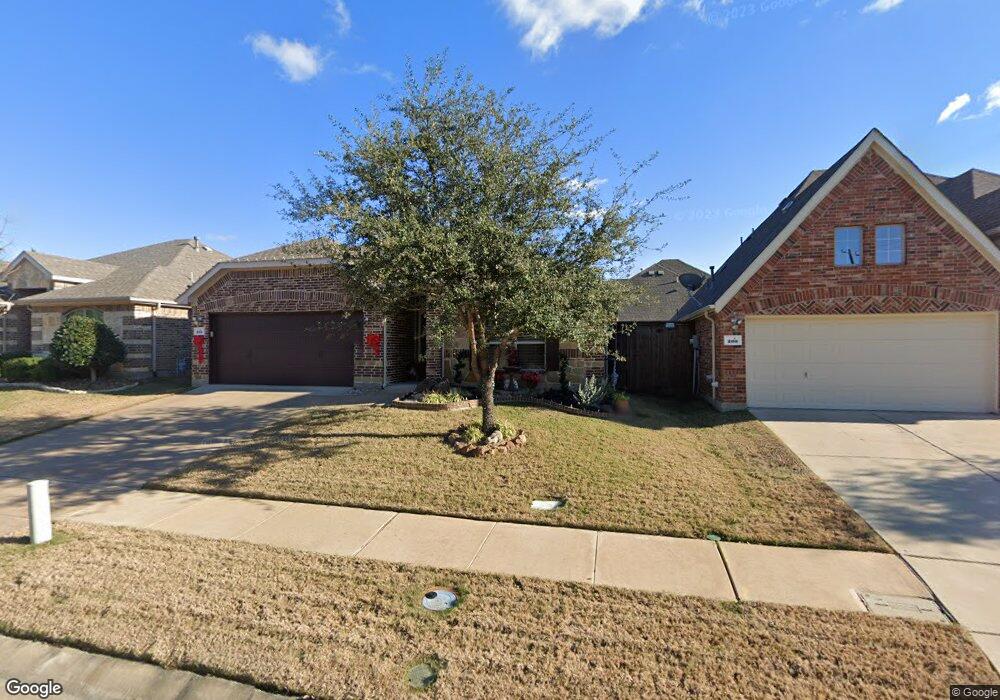
202 Tower Cir Terrell, TX 75160
Estimated Value: $288,000 - $347,000
3
Beds
2
Baths
1,672
Sq Ft
$185/Sq Ft
Est. Value
About This Home
This home is located at 202 Tower Cir, Terrell, TX 75160 and is currently estimated at $309,862, approximately $185 per square foot. 202 Tower Cir is a home located in Kaufman County with nearby schools including Dr Bruce Wood Elementary School, Herman Furlough Jr Middle School, and Terrell High School.
Ownership History
Date
Name
Owned For
Owner Type
Purchase Details
Closed on
May 30, 2023
Sold by
Letendre Janice M
Bought by
Letendre Janice M and Morris Dorothy J
Current Estimated Value
Purchase Details
Closed on
Jun 3, 2013
Sold by
Norton Tom E
Bought by
Letendre Janice M and Morris Dorothy J
Purchase Details
Closed on
May 22, 2012
Sold by
C&N Lp
Bought by
Norton Tom E
Home Financials for this Owner
Home Financials are based on the most recent Mortgage that was taken out on this home.
Original Mortgage
$100,000
Interest Rate
3.93%
Mortgage Type
Construction
Create a Home Valuation Report for This Property
The Home Valuation Report is an in-depth analysis detailing your home's value as well as a comparison with similar homes in the area
Home Values in the Area
Average Home Value in this Area
Purchase History
| Date | Buyer | Sale Price | Title Company |
|---|---|---|---|
| Letendre Janice M | -- | None Listed On Document | |
| Letendre Janice M | -- | None Available | |
| Norton Tom E | -- | Capital Title Of Texas Llc |
Source: Public Records
Mortgage History
| Date | Status | Borrower | Loan Amount |
|---|---|---|---|
| Previous Owner | Norton Tom E | $100,000 |
Source: Public Records
Tax History
| Year | Tax Paid | Tax Assessment Tax Assessment Total Assessment is a certain percentage of the fair market value that is determined by local assessors to be the total taxable value of land and additions on the property. | Land | Improvement |
|---|---|---|---|---|
| 2025 | $2,455 | $294,500 | $70,000 | $224,500 |
| 2024 | $2,455 | $294,987 | -- | -- |
| 2023 | $2,459 | $268,170 | $0 | $0 |
| 2022 | $6,362 | $243,791 | $0 | $0 |
Source: Public Records
Map
Nearby Homes
Your Personal Tour Guide
Ask me questions while you tour the home.