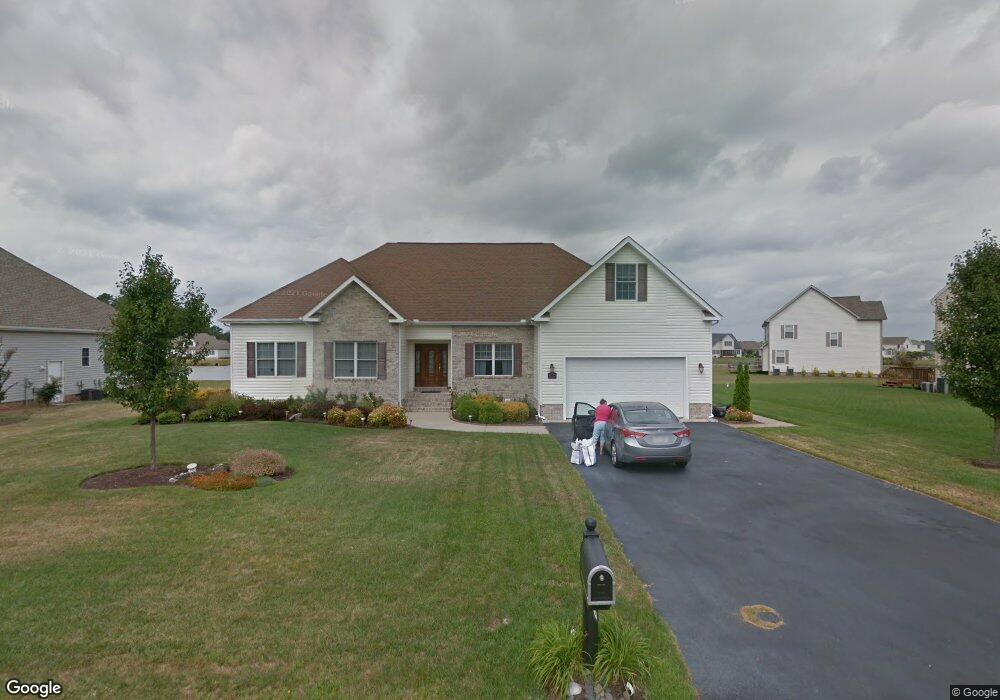
202 Twigg Ct Fruitland, MD 21826
Estimated Value: $388,000 - $404,000
4
Beds
3
Baths
2,096
Sq Ft
$189/Sq Ft
Est. Value
About This Home
This home is located at 202 Twigg Ct, Fruitland, MD 21826 and is currently estimated at $395,280, approximately $188 per square foot. 202 Twigg Ct is a home located in Wicomico County with nearby schools including Fruitland Primary School, Fruitland Intermediate School, and Bennett Middle School.
Ownership History
Date
Name
Owned For
Owner Type
Purchase Details
Closed on
Feb 22, 2017
Sold by
Wiggins Kennedy Keitha
Bought by
Iarocci Martin R and Iarocci Maryann
Current Estimated Value
Home Financials for this Owner
Home Financials are based on the most recent Mortgage that was taken out on this home.
Original Mortgage
$212,500
Outstanding Balance
$175,546
Interest Rate
4.12%
Mortgage Type
VA
Estimated Equity
$219,734
Purchase Details
Closed on
Feb 18, 2011
Sold by
Kennedy John W
Bought by
Kennedy John W and Wiggins Keitha Kennedy
Purchase Details
Closed on
Jun 4, 2010
Sold by
Swank Charlene M
Bought by
Marshall John E
Purchase Details
Closed on
Sep 4, 2009
Sold by
Davis David E and Davis Angela M
Bought by
Swank Charlene M and Swank William R
Purchase Details
Closed on
Feb 20, 2009
Sold by
Hebron Savings Bank
Bought by
Davis David E and Davis Angela M
Create a Home Valuation Report for This Property
The Home Valuation Report is an in-depth analysis detailing your home's value as well as a comparison with similar homes in the area
Home Values in the Area
Average Home Value in this Area
Purchase History
| Date | Buyer | Sale Price | Title Company |
|---|---|---|---|
| Iarocci Martin R | $212,500 | None Available | |
| Kennedy John W | -- | -- | |
| Kennedy John W | -- | -- | |
| Marshall John E | $237,900 | -- | |
| Swank Charlene M | $246,000 | -- | |
| Davis David E | $42,000 | -- |
Source: Public Records
Mortgage History
| Date | Status | Borrower | Loan Amount |
|---|---|---|---|
| Open | Iarocci Martin R | $212,500 | |
| Closed | Davis David E | -- |
Source: Public Records
Tax History Compared to Growth
Tax History
| Year | Tax Paid | Tax Assessment Tax Assessment Total Assessment is a certain percentage of the fair market value that is determined by local assessors to be the total taxable value of land and additions on the property. | Land | Improvement |
|---|---|---|---|---|
| 2025 | -- | $296,133 | $0 | $0 |
| 2024 | -- | $271,400 | $34,300 | $237,100 |
| 2023 | $0 | $257,533 | $0 | $0 |
| 2022 | $2,483 | $243,667 | $0 | $0 |
| 2021 | $0 | $229,800 | $34,300 | $195,500 |
| 2020 | $0 | $218,600 | $0 | $0 |
| 2019 | $2,171 | $207,400 | $0 | $0 |
| 2018 | $2,064 | $196,200 | $34,300 | $161,900 |
| 2017 | $1,964 | $186,733 | $0 | $0 |
| 2016 | $1,851 | $177,267 | $0 | $0 |
| 2015 | $1,851 | $167,800 | $0 | $0 |
| 2014 | $1,851 | $167,800 | $0 | $0 |
Source: Public Records
Map
Nearby Homes
- 172 Nina Ln
- 159 Nina Ln
- 103 Paddock Dr
- 104 Toms Crossing
- 633 E Main St
- 4089 Skylar Dr
- 211 Moonglow Rd
- 3960 Saint Lukes Rd
- 225 Moonglow Rd
- 424 Lena Ln
- 417 Lena Ln
- 229 Sand Castle Blvd
- 212 Green St
- 134 Liberty Way
- 227 N Brown St
- 208 Ringgold Rd
- 210 Ringgold Rd
- 612 S Division St
- 144 Porter Pkwy
- 220 Ringgold Rd