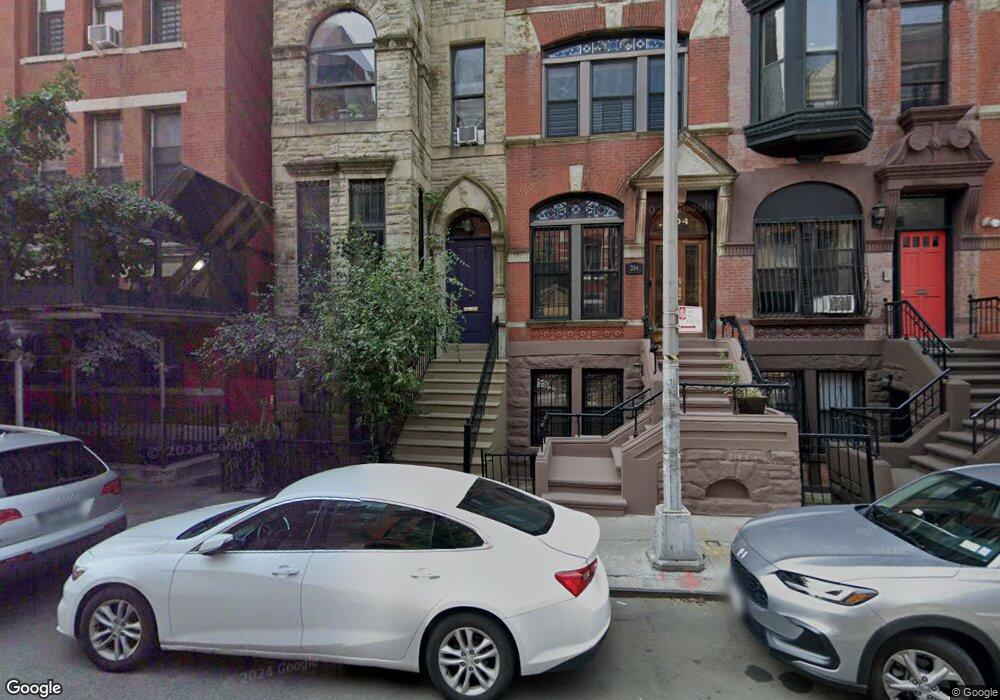
202 W 122nd St New York, NY 10027
Central Harlem NeighborhoodEstimated Value: $2,100,000 - $2,847,096
5
Beds
5
Baths
4,875
Sq Ft
$515/Sq Ft
Est. Value
About This Home
This home is located at 202 W 122nd St, New York, NY 10027 and is currently estimated at $2,509,024, approximately $514 per square foot. 202 W 122nd St is a home located in New York County with nearby schools including P.S. 76 A Phillip Randolph, Harlem Link Charter School, and Harlem Village Academy West Lower Elementary.
Ownership History
Date
Name
Owned For
Owner Type
Purchase Details
Closed on
Aug 2, 2021
Sold by
Keenan Rodney
Bought by
Yuan Yuan Tang Llc
Current Estimated Value
Home Financials for this Owner
Home Financials are based on the most recent Mortgage that was taken out on this home.
Original Mortgage
$1,325,000
Outstanding Balance
$1,204,835
Interest Rate
2.9%
Mortgage Type
Purchase Money Mortgage
Estimated Equity
$1,304,189
Purchase Details
Closed on
Sep 27, 2002
Sold by
Slaton Abigail
Bought by
Joe-Franklin Chinique and Slaton Denise
Purchase Details
Closed on
Aug 28, 2000
Sold by
Classic Townhouses Ltd
Bought by
Keenan Rodney
Home Financials for this Owner
Home Financials are based on the most recent Mortgage that was taken out on this home.
Original Mortgage
$316,000
Interest Rate
7.83%
Mortgage Type
Purchase Money Mortgage
Create a Home Valuation Report for This Property
The Home Valuation Report is an in-depth analysis detailing your home's value as well as a comparison with similar homes in the area
Home Values in the Area
Average Home Value in this Area
Purchase History
| Date | Buyer | Sale Price | Title Company |
|---|---|---|---|
| Yuan Yuan Tang Llc | $2,650,000 | -- | |
| Joe-Franklin Chinique | -- | -- | |
| Joe-Franklin Chinique | -- | -- | |
| Keenan Rodney | $364,500 | The Judicial Title Ins Agenc |
Source: Public Records
Mortgage History
| Date | Status | Borrower | Loan Amount |
|---|---|---|---|
| Open | Yuan Yuan Tang Llc | $1,325,000 | |
| Previous Owner | Keenan Rodney | $316,000 |
Source: Public Records
Tax History Compared to Growth
Tax History
| Year | Tax Paid | Tax Assessment Tax Assessment Total Assessment is a certain percentage of the fair market value that is determined by local assessors to be the total taxable value of land and additions on the property. | Land | Improvement |
|---|---|---|---|---|
| 2025 | $8,829 | $46,597 | $9,716 | $36,881 |
| 2024 | $8,829 | $43,960 | $31,440 | $33,839 |
| 2023 | $8,423 | $41,472 | $9,776 | $31,696 |
| 2022 | $8,279 | $134,760 | $31,440 | $103,320 |
| 2021 | $8,359 | $144,840 | $31,440 | $113,400 |
| 2020 | $7,923 | $153,600 | $31,440 | $122,160 |
| 2019 | $7,370 | $126,060 | $31,440 | $94,620 |
| 2018 | $6,747 | $34,560 | $6,896 | $27,664 |
| 2017 | $6,745 | $34,560 | $7,957 | $26,603 |
| 2016 | $6,074 | $34,299 | $10,660 | $23,639 |
| 2015 | $2,229 | $32,359 | $10,634 | $21,725 |
| 2014 | $2,229 | $30,528 | $8,803 | $21,725 |
Source: Public Records
Map
Nearby Homes
- 203 W 122nd St Unit 4
- 216 W 123rd St
- 240 W 123rd St Unit TERRA
- 265 W 122nd St Unit C
- 157 W 123rd St Unit 2D
- 157 W 123rd St Unit 2C
- 157 W 123rd St Unit 3E
- 157 W 123rd St Unit 5-E
- 157 W 123rd St Unit 2A
- 157 W 123rd St Unit 4C
- 235 W 120th St
- 260 W 121st St
- 148 W 121st St Unit 5
- 148 W 123rd St
- 271 W 122nd St Unit 1
- 135 W 122nd St
- 160 W 120th St
- 2280 Frederick Douglass Blvd Unit 2-G
- 2280 Frederick Douglass Blvd Unit 9-F
- 2280 Frederick Douglass Blvd Unit 11D
- 204 W 122nd St
- 202 W 122nd St Unit PH
- 206 W 122nd St
- 206 W 122nd St Unit 1
- 206 W 122nd St Unit 2
- 206 W 122nd St Unit GARDEN
- 208 W 122nd St Unit D
- 208 W 122nd St Unit 1
- 210 W 122nd St Unit TOWNHOUSE
- 210 W 122nd St
- 212 W 122nd St Unit 3
- 212 W 122nd St
- 2030 Adam Clayton Powell Jr Blvd
- 214 W 122nd St
- 214 W 122nd St Unit 2
- 214 W 122nd St Unit 1
- 216 W 122nd St
- 205 W 121st St
- 205 W 121st St Unit 3
- 203 W 121st St