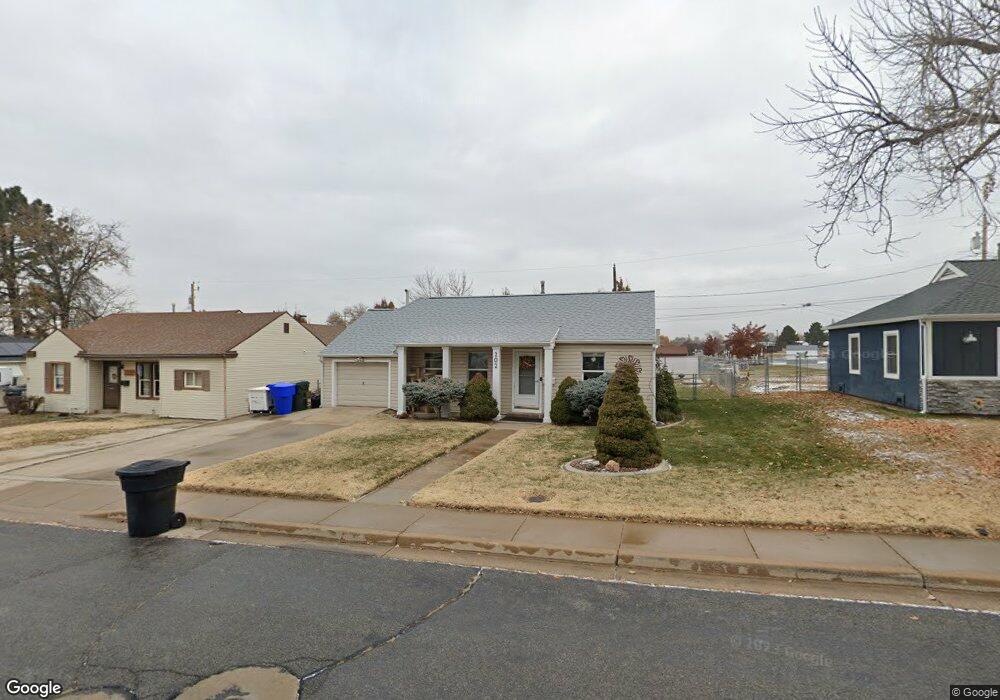
202 W 1900 N Clearfield, UT 84015
Estimated Value: $314,000 - $376,000
2
Beds
2
Baths
1,137
Sq Ft
$304/Sq Ft
Est. Value
About This Home
This home is located at 202 W 1900 N, Clearfield, UT 84015 and is currently estimated at $346,140, approximately $304 per square foot. 202 W 1900 N is a home located in Davis County with nearby schools including Sunset School, Sunset Junior High School, and Northridge High School.
Ownership History
Date
Name
Owned For
Owner Type
Purchase Details
Closed on
Dec 8, 2005
Sold by
Reyna Nina D
Bought by
Waite Lisa A
Current Estimated Value
Home Financials for this Owner
Home Financials are based on the most recent Mortgage that was taken out on this home.
Original Mortgage
$5,375
Outstanding Balance
$2,963
Interest Rate
6.14%
Mortgage Type
Stand Alone Second
Estimated Equity
$343,177
Purchase Details
Closed on
Jul 18, 2001
Sold by
Wilson Brandon B and Wilson Brenda L
Bought by
Reyna Nina D
Home Financials for this Owner
Home Financials are based on the most recent Mortgage that was taken out on this home.
Original Mortgage
$101,036
Interest Rate
7.21%
Mortgage Type
FHA
Purchase Details
Closed on
Dec 29, 1995
Sold by
Schildknecht Thu
Bought by
Wilson Brandon B and Wilson Brenda L
Home Financials for this Owner
Home Financials are based on the most recent Mortgage that was taken out on this home.
Original Mortgage
$71,073
Interest Rate
7.37%
Mortgage Type
FHA
Create a Home Valuation Report for This Property
The Home Valuation Report is an in-depth analysis detailing your home's value as well as a comparison with similar homes in the area
Home Values in the Area
Average Home Value in this Area
Purchase History
| Date | Buyer | Sale Price | Title Company |
|---|---|---|---|
| Waite Lisa A | -- | Equity Title Ins Agency Inc | |
| Reyna Nina D | -- | Gateway Title Insurance Agen | |
| Wilson Brandon B | -- | Associated Title Company | |
| Wilson Brandon B | -- | Associated Title Company |
Source: Public Records
Mortgage History
| Date | Status | Borrower | Loan Amount |
|---|---|---|---|
| Open | Waite Lisa A | $5,375 | |
| Open | Waite Lisa A | $100,105 | |
| Previous Owner | Reyna Nina D | $101,036 | |
| Previous Owner | Wilson Brandon B | $71,073 |
Source: Public Records
Tax History Compared to Growth
Tax History
| Year | Tax Paid | Tax Assessment Tax Assessment Total Assessment is a certain percentage of the fair market value that is determined by local assessors to be the total taxable value of land and additions on the property. | Land | Improvement |
|---|---|---|---|---|
| 2025 | $1,857 | $169,400 | $65,952 | $103,448 |
| 2024 | $1,718 | $156,750 | $63,096 | $93,654 |
| 2023 | $1,605 | $267,000 | $101,580 | $165,420 |
| 2022 | $1,704 | $153,450 | $58,865 | $94,585 |
| 2021 | $1,463 | $207,000 | $59,391 | $147,609 |
| 2020 | $1,258 | $175,000 | $49,392 | $125,608 |
| 2019 | $1,177 | $168,000 | $69,395 | $98,605 |
| 2018 | $1,045 | $146,000 | $55,456 | $90,544 |
| 2016 | $921 | $66,110 | $26,190 | $39,920 |
| 2015 | $872 | $59,290 | $26,190 | $33,100 |
| 2014 | $865 | $60,134 | $25,999 | $34,135 |
| 2013 | -- | $53,335 | $23,265 | $30,070 |
Source: Public Records
Map
Nearby Homes
- 1874 N 200 W
- 1974 N 75 W
- 52 W 2000 N
- 2085 N Main St Unit 409
- 2085 N Main St Unit 108
- 2085 N Main St Unit 401
- 2085 N Main St Unit 308
- 2085 N Main St Unit 116
- 2085 N Main St Unit 201
- 2085 N Main St Unit 402
- 2085 N Main St Unit 202
- 2085 N Main St Unit 301
- 2085 N Main St Unit 302
- 2085 N Main St Unit 115
- 2101 N Main St Unit 205
- 2101 N Main St Unit 409
- 1721 N 400 W
- 1746 N 475 W
- 36 W 1600 N
- 1647 N Main St