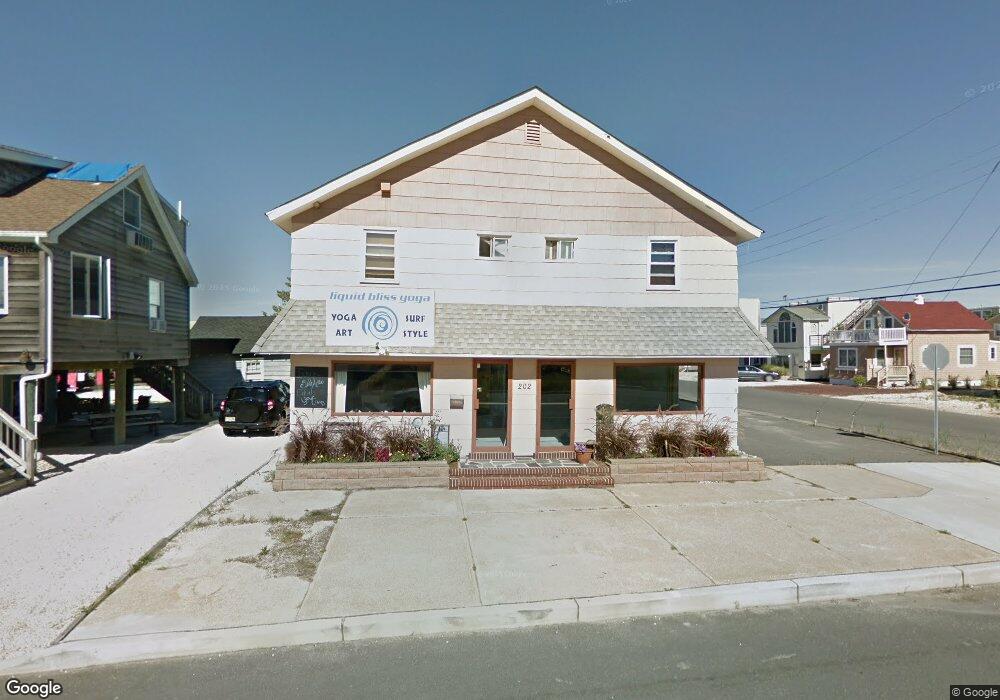
202 W 27th St Unit 4 Ship Bottom, NJ 08008
Long Beach Island NeighborhoodEstimated Value: $792,522
4
Beds
3
Baths
3,192
Sq Ft
$248/Sq Ft
Est. Value
About This Home
This home is located at 202 W 27th St Unit 4, Ship Bottom, NJ 08008 and is currently estimated at $792,522, approximately $248 per square foot. 202 W 27th St Unit 4 is a home located in Ocean County with nearby schools including Ethel A. Jacobsen Elementary School, Long Beach Island Grade School, and Southern Regional Middle School.
Ownership History
Date
Name
Owned For
Owner Type
Purchase Details
Closed on
Sep 13, 2023
Sold by
Fisher Fred and Fisher Linda
Bought by
Frederick A Fisher Family Trust and Linda Fisher Family Trust
Current Estimated Value
Purchase Details
Closed on
Jun 27, 2019
Sold by
Jgs Llc
Bought by
Fisher Fred and Fisher Linda
Purchase Details
Closed on
Jun 3, 2019
Sold by
Jgs Llc
Bought by
Fischer Fred and Fischer Linda
Purchase Details
Closed on
Oct 10, 2014
Sold by
Coppola Benjamin J and Coppola Elaine
Bought by
Jgs Llc
Purchase Details
Closed on
Sep 17, 2007
Sold by
Coppola Elaine and Benjamin Coppola Credit Shelte
Bought by
Coppola Benjamin J
Home Financials for this Owner
Home Financials are based on the most recent Mortgage that was taken out on this home.
Original Mortgage
$462,000
Interest Rate
6.49%
Mortgage Type
Commercial
Create a Home Valuation Report for This Property
The Home Valuation Report is an in-depth analysis detailing your home's value as well as a comparison with similar homes in the area
Home Values in the Area
Average Home Value in this Area
Purchase History
| Date | Buyer | Sale Price | Title Company |
|---|---|---|---|
| Frederick A Fisher Family Trust | -- | Fidelity National Title Insura | |
| Frederick A Fisher Family Trust | -- | Fidelity National Title Insura | |
| Fisher Fred | $400,000 | None Available | |
| Fischer Fred | $400,000 | Fidelity Title Insurance Co | |
| Jgs Llc | $475,000 | -- | |
| Jgs Llc | $475,000 | -- | |
| Coppola Benjamin J | -- | Stewart Title Guaranty Co |
Source: Public Records
Mortgage History
| Date | Status | Borrower | Loan Amount |
|---|---|---|---|
| Previous Owner | Coppola Benjamin J | $462,000 |
Source: Public Records
Tax History Compared to Growth
Tax History
| Year | Tax Paid | Tax Assessment Tax Assessment Total Assessment is a certain percentage of the fair market value that is determined by local assessors to be the total taxable value of land and additions on the property. | Land | Improvement |
|---|---|---|---|---|
| 2025 | $6,399 | $531,000 | $303,200 | $227,800 |
| 2024 | $6,101 | $531,000 | $303,200 | $227,800 |
| 2023 | $5,623 | $531,000 | $303,200 | $227,800 |
| 2022 | $5,623 | $531,000 | $303,200 | $227,800 |
| 2021 | $5,597 | $531,000 | $303,200 | $227,800 |
| 2020 | $5,613 | $531,000 | $303,200 | $227,800 |
| 2019 | $5,655 | $534,500 | $303,200 | $231,300 |
| 2018 | $5,666 | $534,500 | $303,200 | $231,300 |
| 2017 | $5,297 | $534,500 | $303,200 | $231,300 |
| 2016 | $5,058 | $456,900 | $253,800 | $203,100 |
| 2015 | $4,935 | $456,900 | $253,800 | $203,100 |
| 2014 | $4,820 | $446,700 | $253,800 | $192,900 |
Source: Public Records
Map
Nearby Homes
- 109 W 26th St
- 1219 Long Beach Blvd
- 2109 Central Ave
- 1903 Pennsylvania Ave
- 3608B Long Beach Blvd
- 1810 Central Ave Unit 15
- 1810 Central Ave Unit 17
- 3700 W 38th St
- 111 W 18th St Unit 2
- 5 W 40th St
- 7 E 41st St Unit 1
- 4002 Ocean Blvd
- 1306 Barnegat Ave
- 4505-4507 Ocean
- 108 W 10th St
- 1001 Ocean Ave Unit 1017
- 1001 Ocean Ave Unit 1012
- 1001 Ocean Ave Unit C1001
- 2 E 48th St
- 615 Barnegat Ave
- 202 W 27th St
- 2703 Central Ave
- 203 W 28th St
- 203 E 28th St
- 210 W 27th St
- 201 W 28th St
- 2615 Central Ave
- 2704 Central Ave
- 2704 Central Ave Unit A
- 216 W 27th St
- 205 W 27th St
- 112 W 27th St
- 207 W 27th St
- 215 W 27th St
- 113 W 28th St
- 209 W 27th St
- 115 E 28th St Unit A
- 115 E 28th St
- 115 E 28th St Unit B
- 115 E 28th St Unit B