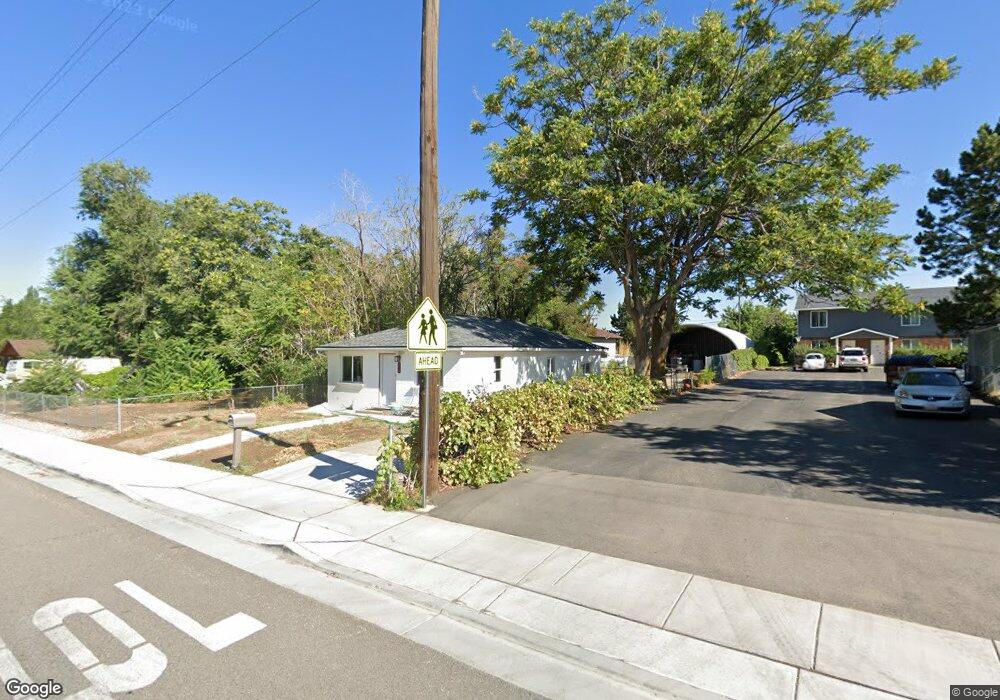
202 W 800 N Clearfield, UT 84015
Estimated Value: $331,000 - $352,000
3
Beds
1
Bath
1,046
Sq Ft
$329/Sq Ft
Est. Value
About This Home
This home is located at 202 W 800 N, Clearfield, UT 84015 and is currently estimated at $344,475, approximately $329 per square foot. 202 W 800 N is a home located in Davis County with nearby schools including Doxey School, Sunset Junior High School, and Northridge High School.
Ownership History
Date
Name
Owned For
Owner Type
Purchase Details
Closed on
Oct 26, 2006
Sold by
Rappaport Helen
Bought by
Sellers Russell R
Current Estimated Value
Home Financials for this Owner
Home Financials are based on the most recent Mortgage that was taken out on this home.
Original Mortgage
$75,500
Outstanding Balance
$44,878
Interest Rate
6.39%
Mortgage Type
Purchase Money Mortgage
Estimated Equity
$299,597
Purchase Details
Closed on
Sep 3, 2003
Sold by
Royal Trading Lp
Bought by
Rappaport Helen
Purchase Details
Closed on
Oct 30, 2002
Sold by
Day Del Mont
Bought by
Royal Trading Lp
Home Financials for this Owner
Home Financials are based on the most recent Mortgage that was taken out on this home.
Original Mortgage
$78,009
Interest Rate
5.99%
Mortgage Type
Purchase Money Mortgage
Purchase Details
Closed on
Aug 22, 1997
Sold by
Martinez Jose M and Martinez Antonia A
Bought by
Martinez Leroy M and Martinez Gilbert J
Create a Home Valuation Report for This Property
The Home Valuation Report is an in-depth analysis detailing your home's value as well as a comparison with similar homes in the area
Home Values in the Area
Average Home Value in this Area
Purchase History
| Date | Buyer | Sale Price | Title Company |
|---|---|---|---|
| Sellers Russell R | -- | Backman Title Services | |
| Rappaport Helen | -- | -- | |
| Royal Trading Lp | -- | -- | |
| Day Del Mont | -- | First American Title Co | |
| Martinez Leroy M | -- | -- |
Source: Public Records
Mortgage History
| Date | Status | Borrower | Loan Amount |
|---|---|---|---|
| Open | Sellers Russell R | $75,500 | |
| Previous Owner | Day Del Mont | $78,009 |
Source: Public Records
Tax History Compared to Growth
Tax History
| Year | Tax Paid | Tax Assessment Tax Assessment Total Assessment is a certain percentage of the fair market value that is determined by local assessors to be the total taxable value of land and additions on the property. | Land | Improvement |
|---|---|---|---|---|
| 2025 | $1,706 | $155,650 | $67,340 | $88,310 |
| 2024 | $1,592 | $145,199 | $64,335 | $80,864 |
| 2023 | $1,485 | $135,850 | $56,290 | $79,559 |
| 2022 | $1,564 | $256,000 | $105,675 | $150,325 |
| 2021 | $1,336 | $189,000 | $64,820 | $124,180 |
| 2020 | $1,164 | $162,000 | $55,109 | $106,891 |
| 2019 | $1,100 | $157,000 | $66,392 | $90,608 |
| 2018 | $973 | $136,000 | $53,057 | $82,943 |
| 2016 | $824 | $59,125 | $25,104 | $34,021 |
| 2015 | $771 | $52,470 | $25,104 | $27,366 |
| 2014 | $608 | $42,293 | $25,161 | $17,132 |
| 2013 | -- | $59,030 | $27,918 | $31,112 |
Source: Public Records
Map
Nearby Homes